Audit NOI and market value: cap rate vs yield for Australian investors

This tool is a generic calculator and does not advertise or promote a specific financial product. It is not intended to be relied on for the purposes of making a decision in relation to a financial product. You should consider obtaining advice from a financial services licensee before making any financial decisions.
Audit NOI and market value: cap rate vs yield for Australian investors
Cap rate measures the annualised return a property generates relative to its current market value, calculated as net operating income divided by market value. Rental yield measures return relative to what was actually paid, usually expressed as gross or net yield on purchase price. Use cap rate when comparing properties or valuing an asset against market comparables, and use rental yield for quick cashflow and affordability checks before you dig deeper.
TL;DR:
- For an early screen, calculate gross or net yield on purchase price; before an offer, compare NOI with an independent market valuation and local sales.
- Include routine operating costs, but separate capital improvement levies; special strata levies may not be immediately deductible, and private or below market family rentals require apportionment.
- Stress test cash flow with vacancy, repairs, possible strata levies, and the lender’s rent haircut, since lenders generally discount advertised rental income.
- Treat a high advertised yield as provisional: verify the expense breakdown, strata history, sinking fund balance, vendor statement, and hidden defects before making an offer.
Table of Contents
- What cap rate and rental yield actually measure
- Working the same property through gross yield, net yield and cap rate
- When cap rate is the right tool, and when yield is
- How ATO rules change your net yield and NOI numbers
- What lenders assume that you probably don’t
- Turning an advertised yield into a real net yield and cap rate
- A decision checklist before you make an offer
- Getting cleaner inputs before you rely on these numbers
- Why the simplest number usually wins the wrong argument
- FAQ
- Sources
What cap rate and rental yield actually measure
Cap rate is net operating income (NOI) divided by current market value:
Cap rate = NOI ÷ market value
NOI is annual rental income minus operating expenses, excluding financing costs and depreciation. Gross yield is simpler: annual rent divided by purchase price. Net yield subtracts operating expenses from that same purchase-price base.
Gross yield = annual rent ÷ purchase price Net yield = (annual rent − operating expenses) ÷ purchase price
Operating expenses typically include:
- Council rates and body corporate or strata levies
- Building insurance and landlord insurance premiums
- Property management and letting agent fees
- Routine repairs and maintenance
The Australian Taxation Office lists which of these are deductible in the year incurred and which must be apportioned. The practical difference between cap rate and yield comes down to the denominator: cap rate anchors to current market value, which moves with the market, while yield anchors to historical purchase price, which never changes. That makes cap rate the better tool for comparing assets bought at different times.
Working the same property through gross yield, net yield and cap rate
A single example shows why these numbers diverge. For instance, consider a unit purchased some years ago where gross yield based on that purchase price appears higher than the net yield or cap rate calculated using current market value and operating expenses. This reflects both the cost of running the property and changes in market value since purchase.
It reflects both the cost of running the property and the fact that the asset has appreciated since purchase.
When cap rate is the right tool, and when yield is
Each metric answers a different question, so the job at hand should decide which one you reach for.
- Use cap rate when comparing properties against local sales comparables or assessing relative risk across asset types and suburbs.
- Use gross or net yield for a fast affordability or cashflow screen early in a search, before committing time to deeper analysis.
- Walk away or renegotiate when the net yield barely covers holding costs under a conservative rent assumption.
- Push for deeper due diligence when a quoted cap rate looks unusually low for the asset class without an obvious growth story behind it.
Cap rate suits valuation-stage decisions. Yield suits the first-pass triage that tells you whether a property is worth analysing further at all.
How ATO rules change your net yield and NOI numbers
Net yield and NOI are only as accurate as the expense figures feeding them, and the ATO’s rental expenses guidance sets the rules for what counts.
- Interest on investment loans, council rates, insurance, agent fees and routine repairs are generally deductible in the year incurred.
- Strata special levies raised for capital improvements are usually not deductible immediately and may only be claimed later as capital works deductions.
- Rent charged below market rate to family members, or private use of the property, requires apportioning expenses to the rental-use portion only.
The ATO worksheet for net rental income sets out expense categories and a worked example that investors can mirror when converting an advertised gross yield into a realistic net figure. Collect every invoice, confirm which capital works rules apply to the property’s age, and treat any one-off special levy as a separate line item rather than folding it into ordinary maintenance.
What lenders assume that you probably don’t
Lenders rarely take a stated rental figure at face value. Most apply a haircut to projected rental income before using it in serviceability calculations, and APRA’s prudential guidance encourages buffers that push lenders toward conservative assumptions rather than optimistic ones. The practical effect is that your borrowing capacity is often based on a lower rent figure than the one advertised.
Before relying on a headline yield, apply your own adjustments:
- A vacancy allowance, since no property is tenanted every week of the year.
- A maintenance reserve for repairs that fall outside routine upkeep.
- A buffer for strata special levies, which can arrive with little notice.
- A margin for auction underquoting, where the eventual purchase price runs well above the advertised range.
Pro tip: Model your cashflow under a deliberately conservative scenario, combining a vacancy allowance, a repair reserve and a lender-style haircut, before deciding whether the deal still works.
Turning an advertised yield into a real net yield and cap rate
Agents often quote the most favourable number available. Converting it into something usable takes a few extra steps.
- Start with an advertised gross yield and asking price to estimate annual rent.
- Deduct typical annual costs such as strata levies, council rates, insurance, management fees and repairs, totalling a substantial amount.
- Calculate net yield on purchase price after expenses.
- Calculate NOI divided by an independent market value based on comparable sales to find the cap rate.
The biggest swing usually comes from strata levies, particularly where a special levy for a sinking-fund shortfall has not been disclosed. Ask directly for the strata history, any upcoming special levies and the building’s sinking-fund balance before you treat either number as reliable.
A decision checklist before you make an offer
Run the numbers in order, then check them against the paperwork.
- Calculate gross yield on the purchase price.
- Calculate net yield after ATO-defined deductible expenses.
- Calculate cap rate using NOI against an independent market value, not the asking price.
- Compare the cap rate to recent comparable sales in the same suburb and asset type.
- Verify the Section 32 or vendor statement and the full strata records for undisclosed levies.
- Apply a lender-style haircut and a contingency buffer before finalising your own numbers.
Watch for quoted yields with no expense breakdown, large or recent special levies, signs of auction underquoting against the eventual sale price, and weak rental demand in the immediate area. During inspection, prioritise structural and hidden-risk items, since an undisclosed defect changes your operating expense forecast more than almost anything else.
Pro tip: Treat any yield figure without a matching expense list as provisional, not final, until you have verified it against the vendor statement and strata minutes.
Getting cleaner inputs before you rely on these numbers
Every formula above is only as reliable as its inputs, and market value, expense history and hidden defects are exactly where advertised figures tend to be weakest. OptiWealth FairBid produces independent fair market valuations using spatial AI and hedonic pricing models, rather than relying on an agent’s asking price.
- Fair market valuations that are independent from vendor-side pricing.
- AI flags for council overlays, flood and bushfire risk, and structural defects.
- Strata and special-levy checks that reveal costs an advertised yield often omits.
Audited inputs, an independent market value, a verified expense history and a defect or overlay flag, narrow the range of plausible cap-rate and net-yield outcomes for a given property. Where a calculation materially affects your buy or decline decision, a sample property report shows what verified inputs look like in practice.
Why the simplest number usually wins the wrong argument
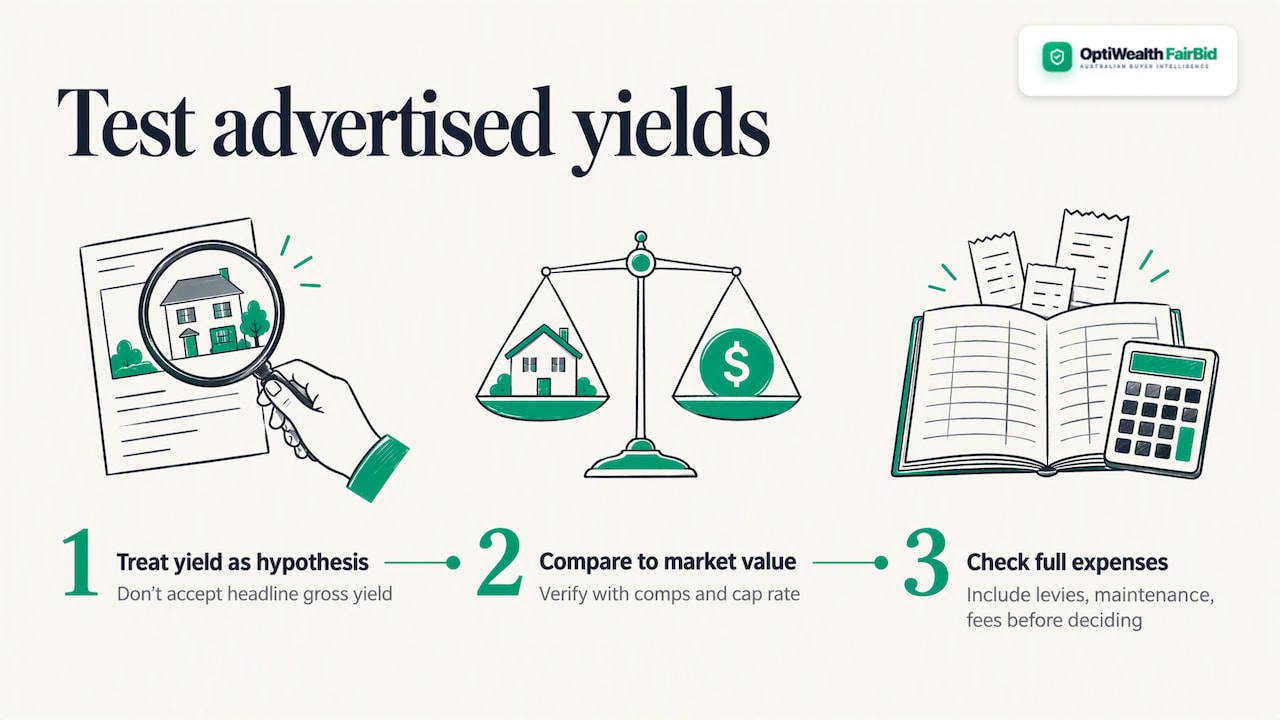
The conventional advice tells investors to chase the highest yield, and that advice undersells how often a high yield reflects low capital growth, higher risk, or expenses the quote simply left out. A 6% gross yield on a property with a looming strata special levy is not better than a 4% net yield on a well-maintained asset with strong comparable sales support. Cap rate deserves more attention than it gets in casual property discussion, precisely because it forces a market-value comparison rather than letting a stale purchase price flatter the numbers.
The single habit worth adopting is treating every advertised yield as a starting hypothesis, not a conclusion, and testing it against an independently sourced market value and a full expense history before it enters any investment decision. Cap rate and net yield converge on something close to the truth only when both inputs are trustworthy.
— JeongSuk Lee
FAQ
What does 7.5% cap rate mean?
It typically signals a higher expected return but often comes with higher risk or weaker growth prospects than a lower cap rate asset in the same category.
Is 12% a good cap rate?
It is worth checking the market value and expense figures behind the number before treating it as attractive.
What does a 6% cap rate mean?
It suggests a stronger income return relative to value, though it should be compared against local comparable sales to judge whether it reflects genuine value or added risk.
Is a 3% cap rate bad?
The Australian Property Institute’s valuation guidance treats a low cap rate as often reflecting market confidence and expected capital growth, rather than poor performance on its own.
Sources
- How to claim rental expenses | Australian Taxation Office
- Valuation approaches and methods (Australian Property Institute)
Recommended
The information provided in this publication is for educational and general information purposes only and does not constitute financial, investment, taxation, or legal advice under the Corporations Act 2001 (Cth). Property buyers and investors should conduct independent physical, legal, and strata due diligence and seek advice from a licensed financial advisor, solicitor, or conveyancer tailored to their personal objectives before entering into any legally binding contract of sale.
OptiWealth Research
Transparent Data Science & EngineeringData Science, Software Architecture & Mathematical Risk Modeling Group
Authored by OptiWealth’s Quantitative & Data Engineering division. Our team specializes in full-stack software architecture, open-source data science, and spatial econometric property valuation (such as hedonic price regression, environmental zoning overlay synthesis, and cash-flow yield analytics). All underlying algorithms and calculation formulas are fully transparent, open to inspection, and designed purely for financial and property data visualization.
Expose Hidden Property Risks & Liabilities
OptiWealth replaces guessing games with algorithmic diagnostics. Use FairBid to audit council overlays, building defects, and calculate true net property yields.