Decoding Real Estate Risk: The AI Qualitative Engine

When evaluating a residential property in Australia, traditional Automated Valuation Models (AVMs) present buyers with a single, deceptive figure: an estimated dollar price. Retail buyers routinely rely on these automated estimates, assuming that if a bank's desktop valuation approves the contract price, the investment is secure.
However, in institutional quantitative finance, a property's financial valuation is only half the equation. An asset may possess a clean title and an attractive headline yield on paper, yet remain exposed to severe, unquantified qualitative liabilities. Uninspected strata tribunal disputes, hidden non-compliant combustible cladding, localised flash-flood overlays, and shifting municipal statutory taxes can quietly dismantle a buyer's equity long after the auction gavel falls.
At OptiWealth AU, we replace retail guesswork with Algorithmic Precision. By integrating multi-factor quantitative modelling with our proprietary AI Qualitative Engine and Conflict Resolution Engine, our platform synthesises structured financial metrics with unstructured municipal data.
In this article, we unpack the technical architecture of our qualitative risk engine—exploring how the Analytic Hierarchy Process (AHP), strict Defect Override Rules, the 5 Core Qualitative Indicators, and Suburb-Level Surveys deliver Institutional-Grade Tail-Risk management straight to your dashboard.
Key Takeaways
- Beyond Standard Valuations: Traditional Automated Valuation Models (AVMs) present a deceptive single-dollar figure, leaving buyers exposed to unquantified liabilities like hidden strata disputes and municipal overlays.
- Algorithmic Conflict Resolution: OptiWealth’s AI engine ingests unstructured textual data—such as body corporate audits and council plans—and translates them into standardised mathematical inputs using the Analytic Hierarchy Process (AHP).
- The Defect Override Rule: Severe structural defects or active litigation automatically escalate an asset's profile to a Tier 4 Critical Risk, ensuring fatal physical flaws are never masked by favourable macro-demographics.
- Comprehensive Risk Coverage: The platform evaluates 5 Core Qualitative Indicators (including Capex, Insolvency, and Environmental risks) alongside Suburb-Level Surveys to establish a data-driven downside bound for any property.
- Protect Your Capital: By synthesising structural reality with financial metrics, retail buyers can avoid emotional bidding and walk away from hidden capital traps.
The Architecture of the Conflict Resolution Engine
Standard real estate valuation tools fail because they treat qualitative data as an afterthought. A standard bank desktop model cannot read a 120-page body corporate audit, nor can it cross-reference a suburb's revised Local Government Area (LGA) flood map against an asset's historical maintenance reserves.
OptiWealth bridges this divide through the Conflict Resolution Engine. Powered by Explainable AI and natural language processing, the engine ingests unstructured textual data—including municipal planning scheme amendments, building defect press registries, strata meeting minutes, and council heritage overlays—and translates them into standardised mathematical inputs.
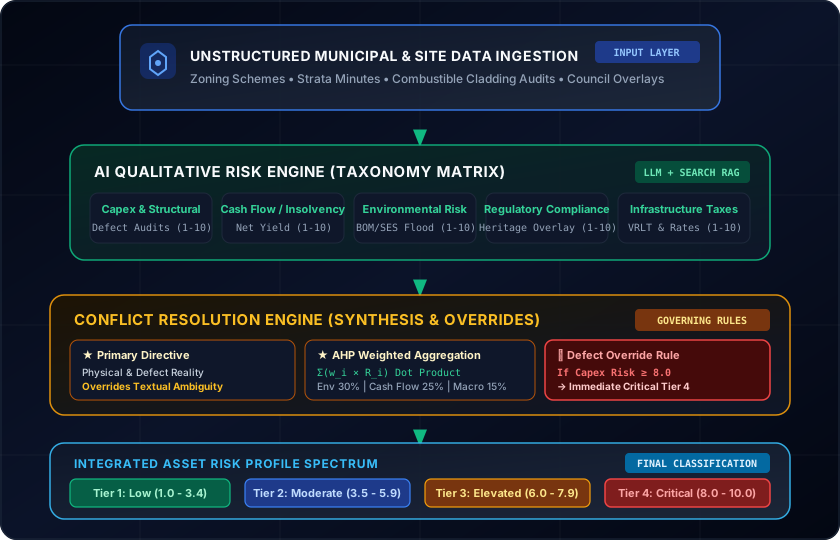
The engine operates under a fundamental governing directive: Physical and Financial Reality Overrides Textual Ambiguity. A property boasting a pristine interior style and a clean title overlay is irrelevant if its physical structure incurs a severe capex penalty or if its adjusted net yield is operating in a cash deficit.
Analytic Hierarchy Process (AHP) Aggregation
To aggregate multi-dimensional risks without bias, OptiWealth utilises the Analytic Hierarchy Process (AHP)—a mathematical framework developed by Thomas L. Saaty for organising and analysing complex decisions. Rather than treating all risk factors equally, our model applies calibrated dot-product weightings across seven core quantitative and qualitative dimensions:
In simple terms, this formula calculates a consolidated risk rating by multiplying each specific risk factor by its designated level of importance to the overall investment.
Where the criteria weightings () reflect their empirical impact on long-term capital preservation:
- Environmental Risk ( / 30%): Direct physical vulnerability (flooding, bushfire) represents the highest un-hedgeable capital loss threat.
- Cash Flow & Insolvency Risk ( / 25%): Operational net yield sustainability and debt-servicing friction.
- Macro Stability ( / 15%): State and national economic indicators, interest rate sensitivity, and bond yield spreads.
- Suburb Level Survey ( / 10%): Heuristic LGA planning shifts, oversupply risks, and municipal development pipelines.
- Regulatory Compliance Risk ( / 8%): Planning overlay friction, heritage development restrictions, and zoning constraints.
- Infrastructure Tax Risk ( / 7%): Statutory tax headwinds, developer contribution levies, and municipal rate indexation.
- Volatility Score ( / 5%): Rolling 10-year suburb price standard deviation.
The Defect Override Rule
A major flaw of traditional linear weighting models is that an exceptionally high score in one category can mask a catastrophic failure in another. For example, a property in a blue-chip suburb with zero flood risk might receive a low weighted risk score, even if the building itself suffers from active structural cracking.
To solve this, OptiWealth’s Conflict Resolution Engine enforces a strict Defect Override Rule:
Put simply, if the property has a critical physical defect, that high defect score overrides the average to become the overall risk score, ensuring fatal flaws are never buried by good scores in other areas.
When our AI engine detects severe building defects, active strata litigation, or combustible cladding notices resulting in a Capex & Structural Risk score of 8.0 or higher, it immediately overrides the standard AHP weighted sum. The asset's overall risk profile is automatically escalated to Tier 4 (Critical Risk), drastically reducing the likelihood that critical structural liabilities remain hidden behind favourable macro-demographics.
Deep-Dive: The 5 Core Qualitative Indicators
To ensure complete analytical coverage without logical gaps or overlaps, OptiWealth categorises qualitative asset evaluation into five distinct indicators scored on a 1 to 10 scale (where 10 represents maximum risk).
1. Capex & Structural Risk (1–10 Scale)
Physical building degradation represents one of the most sudden drivers of capital destruction for Australian property owners.
Our engine cross-references property building age, construction era, and strata records against databases such as Cladding Safety Victoria and the NSW Cladding Taskforce:
- Active Defect Findings (Score 9–10): If search grounding or user-uploaded strata documentation reveals non-compliant combustible cladding, un-budgeted balcony membrane failures, or active body corporate litigation, the engine assigns an immediate 9 or 10 score, triggering the Defect Override Rule.
- Historical Building Maintenance (Score 4–6): For established dwellings constructed prior to 1990 without active structural litigation, if the calculated annual maintenance reserve is of the asset's estimated value, the engine maps the score to a moderate 4–6 range, accurately reflecting routine maintenance overheads rather than structural failure.
- SHAP Age Penalties: If the underlying Hedonic Pricing Model detects an "Age Degradation" penalty exceeding -$25,000 AUD, a minimum Capex Risk score of 5 is enforced.
2. Cash Flow & Insolvency Risk (1–10 Scale)
While headline gross yields measure prospective income, Cash Flow & Insolvency Risk evaluates an owner's operational survival against holding costs and interest rate shocks.
Following the Australian Prudential Regulation Authority (APRA) guidelines—which enforce strict serviceability buffers and Debt-to-Income (DTI) monitoring—our qualitative engine stress-tests cash flow sustainability:
- Investment Properties:
This calculation reveals the true operational income by stripping away hidden holding costs and statutory obligations from the advertised rent.
If the Adjusted Net Yield falls below 0.00% (negative cash flow), the asset receives a 10/10 (CRITICAL) insolvency risk rating. Thin net yield margins between 0.00% and 1.50% receive an elevated score of 7 to 9.
- Owner-Occupied Properties: Tenancy default risks do not apply. Instead, the engine measures annual holding costs (property rates, building insurance, and structural reserves) relative to total asset value. Holding costs exceeding of asset value per annum trigger an elevated score of 5 to 7.
3. Environmental Risk (1–10 Scale)
Climate volatility and expanding floodplains pose increasing risks to Australian real estate value. Escalating landlord and building insurance premiums can quickly turn a cash-flow positive property into a holding liability.
OptiWealth overlays spatial data from the Bureau of Meteorology (BOM), State Emergency Services (SES), and municipal planning maps:
- Direct Overlays (Score 7–10): Properties located within designated 1-in-100-year flood overlays or high Bushfire Attack Level (BAL-29 to BAL-FZ) zones receive high risk scores, reflecting extreme insurance premium inflation and capital discount risks.
- LGA Flash Flood History (Score 2–4): Properties with clean title overlays situated in LGAs with documented flash-flooding micro-climates receive a low-to-moderate rating.
- Clear Elevation (Score 1): Sites situated outside environmental hazard zones score a baseline 1.
4. Regulatory Compliance Risk (1–10 Scale)
Regulatory and planning restrictions dictate what an owner can actually do with their land. Heritage overlays, council setback rules, and restrictive zoning can severely cap future capital appreciation and extension potential.
- Direct Heritage Overlays (Score 8–10): A direct Heritage Overlay (e.g., Victorian Heritage Register or municipal heritage conservation precinct) limits internal structural alterations, window replacements, and solar installations, triggering an 8 to 10 score.
- Street-Level Contiguity (Score 4–6): A clean property situated on a street dominated by heritage-listed dwellings receives a moderate 4–6 score due to visual contiguity constraints imposed by local council planning panels.
- Zoning Density Friction: The engine evaluates planning schemes (e.g., General Residential Zone vs. Activity Centre Zone), penalising sites where zoning restrictions prevent future value-add developments.
5. Infrastructure Tax Risk (1–10 Scale)
Holding property incurs ongoing statutory obligations that scale with state and local government fiscal policies.
Our engine tracks state-level statutory policy shifts and local government taxation updates:
- State Land Tax & Vacancy Penalties: Evaluating exposure to policies such as the Victorian Vacant Residential Land Tax (VRLT)—which levies a 1% to 3% tax on the capital improved value of unoccupied residential land—and shifting state land tax brackets across NSW and Queensland.
- Developer Contribution Levies & Rates: Assessing localised council rate indexation spikes and statutory infrastructure contributions that reduce net investor distributions.
Suburb-Level Surveys: LGA Planning & Spatial Heuristics
A property does not exist in isolation; it is anchored within a broader municipal ecosystem. While lot-level analysis evaluates boundary lines, OptiWealth’s Suburb-Level Risk Surveys examine broader Local Government Area (LGA) developments.
Our qualitative engine conducts heuristic suburb surveys across three structural dimensions:
- Zoning & Master Development Pipelines: Analysing council master plans to detect high-density residential rezoning approvals. A sudden influx of 500+ unit approvals within a 1-kilometre radius introduces severe localised oversupply risk, capping capital growth for nearby townhouses and apartments.
- Environmental Vulnerability Overlays: Evaluating suburb-wide drainage capacity, historical catchment performance during extreme weather events, and micro-spatial urban heat island impacts.
- Local Tax & Statutory Headwinds: Monitoring municipal council rate hikes, local infrastructure contribution schemes, and state policy updates across postcodes.
The survey generates an aggregated Suburb Survey Score (1–10), contributing a 10% weighted factor to the overall AHP asset risk calculation.
Case Study: Resolving Risk Conflicts in a Live Transaction
To observe the AI Qualitative Engine in action, consider a real-world scenario involving an inner-ring townhouse in Melbourne's eastern suburbs.
| Property Metric | Asset Input / Engine Result |
|---|---|
| Address | Inner-Eastern Suburbs, VIC |
| Property Type | 2-Bed, 1-Bath Townhouse (Built 1988) |
| Headline Purchase Price | $1,350,000 |
| Advertised Gross Yield | 5.00% ($67,500 annual rent) |
| Conventional AVM Rating | "Low Risk / Sound Investment" |
A retail buyer relying on a standard AVM sees a 5.0% gross yield and a blue-chip suburban postcode. The conventional bank desktop valuation approves the contract price.
However, when audited through OptiWealth AU, our AI Qualitative Engine ingests the body corporate audit history and localised municipal planning schemes:
| Risk Category / Dimension | Audit Score | Rating & Synthesis Justification |
|---|---|---|
| 1. Capex & Structural Risk | 9 / 10 | [DEFECT OVERRIDE ACTIVATED] 2025 Strata Tribunal audit reveals $85,000 per-lot special levy for balcony membrane & waterproofing failure. |
| 2. Cash Flow & Insolvency Risk | 8 / 10 | [ELEVATED RISK] Special levy & maintenance reserve reduces Adjusted Net Yield from +5.00% to +0.85%. |
| 3. Environmental Risk | 2 / 10 | [LOW RISK] Located within established urban zone with clear elevation; zero active flood overlays. |
| 4. Regulatory Compliance Risk | 4 / 10 | [MODERATE] Clean title, street-level contiguity constraints (General Residential Zone). |
| 5. Infrastructure Tax Risk | 5 / 10 | [MODERATE] Exposed to Victorian land tax adjustments; offset by proximity to rail infrastructure. |
| 6. Suburb Survey Score | 3 / 10 | [STABLE OUTLOOK] Low oversupply risk; post-code drainage infrastructure capacity remains robust. |
| TOTAL INTEGRATED RISK SCORE | 9.00 / 10 | TIER 4 (CRITICAL RISK) — Defect Override Rule Triggered |
The Algorithmic Breakdown:
Important Note: OptiWealth provides data-driven risk modelling based on available statutory and strata documentation. This analysis serves as a powerful quantitative filter but is not a substitute for a physical building and pest inspection conducted by a licensed professional.
- Defect Override Trigger: Despite clean macro-demographics, the discovery of the $85,000 special levy for balcony waterproofing failures triggers an immediate Capex Risk score of 9/10. The Defect Override Rule fires, overriding standard AHP weightings to set the total asset risk score directly to 9.00 (Tier 4 Critical Risk).
- Net Yield Compression: Factoring the required structural reserve into our net cash flow model causes the Adjusted Net Yield to plummet from an advertised +5.00% to a razor-thin +0.85%, exposing the buyer to severe debt-servicing friction.
- Confidence Interval & Downside Bounds: Reflecting the structural uncertainty, the engine widens the Forecast Standard Deviation (FSD) from a baseline 6.5% to 12.0%. Applying our 18% stress-test discount establishes a data-driven 3-Year Bear Case Downside Bound:
This establishes a data-driven absolute price floor, factoring in the maximum potential financial impact of the identified structural uncertainties.
Armed with this insight, the OptiWealth user deploys their Auction Shield. Recognising that the true downside risk floor sits at $1,107,000, they establish a strict walk-away limit and refuse to engage in emotional bidding. Three months later, the unassisted buyer who won the auction is hit with the unexpected $85,000 strata levy.
Algorithmic Precision Over Emotional Guesswork
Navigating the Australian property market demands more than intuition; it requires Quantitative Synergy. By pairing multi-factor hedonic valuation with an AI-driven qualitative conflict resolution engine, OptiWealth AU empowers everyday buyers to see past marketing facades and uncover true downside liabilities.
Stop guessing. Don't let hidden liabilities dismantle your equity. Run a comprehensive Real Estate Risk Audit with OptiWealth AU today, and step into your next auction with absolute certainty.
Disclaimer: The information provided in this article is for educational and data analytics purposes only. It does not constitute personal financial, investment, or legal advice. OptiWealth AU provides data-driven insights; you should always consult with a licensed financial professional before making any purchasing or investment decisions.
Expose Hidden Portfolio & Property Risks
OptiWealth replaces guessing games with algorithmic diagnostics. Create a free account to audit your stock variance or calculate true net property yields.