Australian Property Risk Deep Dive: Inspection Shock to Fair Value | FairBid
This tool is a generic calculator and does not advertise or promote a specific financial product. It is not intended to be relied on for the purposes of making a decision in relation to a financial product. You should consider obtaining advice from a financial services licensee before making any financial decisions.
To an untrained eye browsing the window of a luxury jeweller on Collins Street or Castlereagh Street, a two-carat Colombian emerald looks breathtaking. It is cut into a crisp, symmetrical octagon, bathed in warm halogen spotlights, and mounted in mirror-polished platinum. The green is deep, velvety, and magnetic.
Now hand that exact same stone to a master gemmologist who has spent forty years hunched over an optical bench.
He does not care about the superficial sparkle. He does not even look at the stone under room lighting. He reaches into his waistcoat pocket, pulls out a 10x achromatic triplet loupe, clicks on a darkfield polarising microscope, and rotates the stone slowly against the beam.
Within three seconds, his trained eye sees what the retail customer was never meant to see: a jagged, unhealed cleavage plane running diagonally through the girdle, a microscopic pocket of iron pyrite inclusion near the pavilion, and traces of green-tinted cedarwood resin injected into micro-fissures to mask internal fractures under showroom halogen lamps.
To the casual buyer, it is a magnificent $35,000 heirloom. To the gemmologist, it is a ticking timebomb: a stone with a compromised internal crystal lattice that will shear cleanly in two the first time the owner accidentally knocks their ring against a granite kitchen benchtop.
Australian residential real estate operates on the exact same psychological illusion.
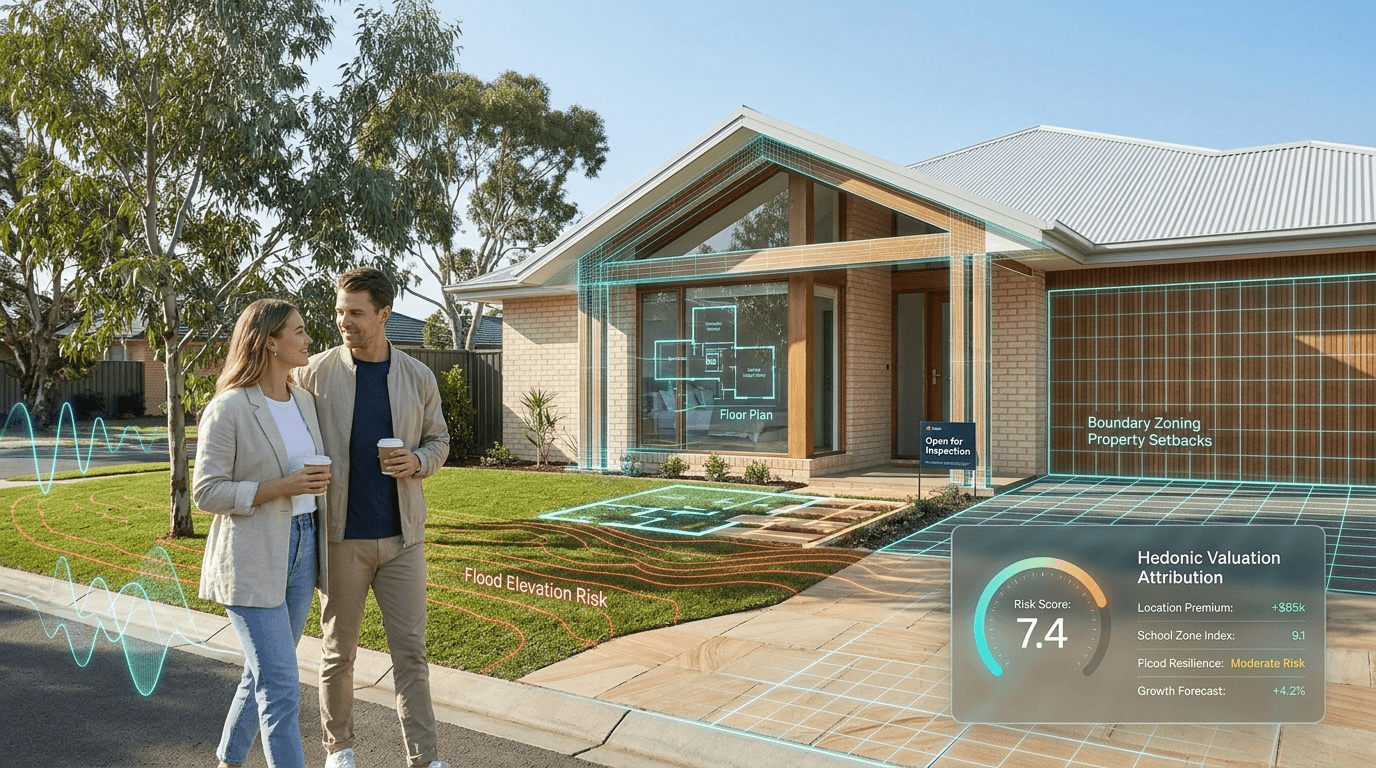
Every Saturday morning across Sydney, Melbourne, Brisbane, and Adelaide, hundreds of thousands of couples walk through open-house inspections. They admire the polished spotted-gum floorboards, the freshly resurfaced stone benchtops, the scented soy candles burning in the master bedroom, and the sunny timber deck. They glance at the glossy agent brochure, open their favourite bank app, and check the desktop Automated Valuation Model (AVM):
Reassured by that single, seductive dollar figure, they register their bidding paddles.
What neither the bank desktop model nor the glossy brochure tells them is that underneath the fresh coat of low-sheen acrylic paint lies the real estate equivalent of a fatal cleavage plane: an unbudgeted $80,000 combustible cladding levy buried on page 240 of the strata tribunal minutes; an unnoted 1-in-100-year overland flood path slicing across the rear easement; an acoustic decibel penalty from a nearby freight corridor that knocks 8% off future capital growth; or a statutory school zone intake boundary that runs down the exact white line in the middle of their street, placing their home twenty metres on the wrong side of a top-tier public school catchment.
At OptiWealth AU, we built the FairBid Property Intelligence Engine to replace retail guesswork with forensic institutional rigour. In this deep dive, we unpack the architecture of our multi-tier risk engine—exploring how we pair empirical due diligence with the Analytic Hierarchy Process (AHP), strict Defect Override Rules, and Hedonic SHAP Attribution to calculate the Risk-Adjusted Walk-Away Ceiling for any residential property in Australia.
Key Takeaways
- The Single-Price AVM Illusion: Conventional Automated Valuation Models price properties based on historical median sales and bedroom counts, remaining completely blind to qualitative liabilities like special levies, council overlays, and acoustic noise.
- Essential Property Inspection Checklist Australia: True pre-purchase due diligence requires inspecting far beyond cosmetic staging—auditing strata sinking funds, overland flow paths, road acoustic buffers, and statutory school zones.
- The Defect Override Invariant: Traditional linear weighted averages fail because a blue-chip postcode cannot fix a crumbling balcony. When our engine detects a critical physical or legal flaw (), the defect score overrides the entire model.
- Hedonic SHAP Attribution: Rather than guessing discounts, our engine statistically estimates the marginal contribution of individual risk factors—such as arterial road decibels, flood overlays, and title encumbrances—directly against verified market transactions.
- Dual-Tier Calculation Architecture: FairBid differentiates between rapid open-house triage (Free Tier single-pass consolidation) and forensic contract-exchange due diligence (Paid Tier multi-phase econometric modeling).
- The Risk-Adjusted Walk-Away Ceiling: Knowing the true risk profile allows buyers to establish a disciplined, data-backed bidding ceiling, insulating their life savings against high-pressure emotional bidding wars.
1. The Human Reality of Due Diligence: 5 Inspection Traps That Catch Buyers Blind
Before exploring the underlying linear algebra and spatial telemetry, we must address an uncomfortable truth about property acquisitions: homebuyers do not experience property transactions as abstract spreadsheets; they experience them as escalating domestic anxiety.
When an Australian couple spends eight months trekking across suburban open-house circuits, the pain is visceral. It is the cold dread of realizing you just spent your entire Saturday morning sprinting between three inspections across town, only to discover the property you fell in love with has an uninspected structural defect that will swallow your first three years of mortgage repayments.
Most buyers rely on superficial indicators: fresh paint, tidy landscaping, and agent price guides. However, property values are heavily dictated by five fundamental risk vectors that rarely appear on standard marketing listings:
- Unfunded Strata Capital Expenditure: Hidden combustible cladding notices, balcony membrane failures, and depleted capital works funds.
- Arterial Acoustic Noise: Heavy transit freight corridors that permanently depress resale demand and capital growth.
- Statutory Cadastral Boundaries: School catchment lines that divide streets down the middle, invalidating expected enrollment premiums.
- Hydrological Overland Drainage: 1-in-100-year municipal flood corridors that inflate insurance and restrict backyard building envelopes.
- Net Yield Cash Flow Bleeds: Shifting statutory state land tax thresholds and APRA serviceability buffers that turn nominal positive gearing into negative cash flow.
Let's examine how FairBid's algorithmic risk deconstruction isolates and prices each of these five critical vectors.
2. The 5 Core Property Risk Vectors: Real-World Dilemma vs. Algorithmic Reality
flowchart TD
    subgraph Dilemma["The Weekend Inspection Reality"]
        H1["1. Strata Report Red Flags<br/>(Hidden Cladding & Waterproofing)"]
        H2["2. Arterial Road Noise Impact<br/>(Transit Corridor Decibel Shock)"]
        H3["3. School Catchment Boundary Mirage<br/>(20m Cadastral Intake Trap)"]
        H4["4. Municipal Overland Flow Overlays<br/>(1-in-100-Year Drainage Path)"]
        H5["5. Holding Cost Cash Flow Bleed<br/>(Gross Yield vs Net Holding Deficit)"]
    end

    subgraph Engine["FairBid Quantitative Risk Architecture"]
        E1["Conflict Resolution Engine &<br/>Defect Override Rule (Capex ≥ 8.0)"]
        E2["Hedonic SHAP Attribution &<br/>Acoustic Decibel Decay Model"]
        E3["Cadastral Boundary Mapping &<br/>Statutory School Zone Polygon Mesh"]
        E4["Hydrological Basin Spatial Overlay &<br/>Insurance Escalation Calibration"]
        E5["APRA 300 bps Serviceability Buffer &<br/>Adjusted Net Yield Liquidity Floor"]
    end

    H1 --> E1
    H2 --> E2
    H3 --> E3
    H4 --> E4
    H5 --> E5
Vector 1: Capex & Structural Defect Risk (Strata Report Red Flags Melbourne Sydney)
The Real-World Inspection Dilemma
A couple purchases an inner-ring apartment, thrilled to have negotiated $5,000 off the advertised guide. Three weeks after moving in, an official envelope arrives from the Owners Corporation: an extraordinary general meeting has gazetted an $80,000 per-lot special levy for combustible aluminium composite cladding rectification and balcony membrane failure. The liability was documented on page 240 in appendix G of the strata meeting minutes, completely bypassed by their standard conveyancing summary.
The Algorithmic Architecture Behind the Screen
Standard bank valuation tools examine an apartment block's postcode, recent sales history, and square meterage. They cannot parse a 300-page scanned PDF containing the minutes of an Annual General Meeting held three Tuesdays ago.
FairBid’s AI Qualitative Engine continuously monitors state-level defect registers (including Cladding Safety Victoria and the NSW Project Intervene taskforce) while extracting structured parameters from user-uploaded strata audits.
When the engine detects un-budgeted building capex, combustible EPS cladding, or structural waterproofing litigation, it calculates the required capital restoration reserve. If the required levy exceeds $25,000 per lot, or if active litigation threatens the sinking fund:
Most crucially, this triggers our :
This mathematical circuit breaker prevents a building with catastrophic structural defects from being rated as a "safe purchase" simply because it is located in a prestigious suburb with high historical capital growth.
Vector 2: Spatial & Acoustic Headwinds (How Much Does Road Noise Devalue a House?)
The Real-World Inspection Dilemma
Open inspections are almost universally scheduled for Saturday mid-mornings or quiet Sunday afternoons when heavy commercial haulage is legally restricted or industrial traffic is at its weekly trough. A buyer inspects a leafy home, enchanted by the birds chirping in the garden. On their first Monday morning after settlement, however, 40-tonne commercial B-double trucks begin thundering past the front gate at 6:45 AM, rattling window panes and revealing that the quiet weekend street is actually a gazetted state arterial freight bypass.
The Algorithmic Architecture Behind the Screen
In institutional property econometrics, ambient acoustic noise represents an enduring economic adjustment. Properties situated directly on primary state arterials (e.g., roads classified by VicRoads as Transit Arterials or Transport for NSW as State Corridors) trade at a persistent, un-hedged discount relative to dwellings located just 150 metres inside the quiet residential grid.
FairBid evaluates this using Hedonic SHAP Attribution (Shapley Additive Explanations). Rather than relying on static suburb averages, our pricing engine statistically estimates the marginal contribution of acoustic exposure:
Where:
- represents the calibrated econometric discount per decibel above ambient baseline (typically to per decibel above 55 dB(A) for residential properties).
- , where is the perpendicular distance in metres to the centreline of the road reserve.
On a $1,500,000 suburban dwelling, direct arterial road exposure generates an acoustic penalty that typically models between -$90,000 AUD to -$125,000 AUD (-6.0% to -8.3%). If an unassisted retail buyer bids based on the median price of houses located two streets back, they risk overpaying substantially.
💡 Pre-Auction Due Diligence Check:
Inspecting a prospective home this weekend? Don't wait until auction day to uncover hidden costs.
Check your prospective address's acoustic decay, strata history, and flood overlays instantly on FairBid
Vector 3: Regulatory & Statutory Boundary Risk (The Catchment Boundary Mirage)
The Real-World Inspection Dilemma
A family stretches their borrowing budget by $100,000 to purchase a weatherboard home advertised as situated in a "Prime High-Decile School Precinct". When attempting to enroll their child the following January, the state school principal rejects the application: the official statutory intake zone runs down the exact cadastral centreline of their street. Odd-numbered houses on the northern side are entitled to entry; their even-numbered house on the southern side sits twenty metres outside the zone.
The Algorithmic Architecture Behind the Screen
In Australia's capital cities, access to top-ranking state schools represents one of the strongest demand drivers in the property market. Historical market studies consistently show that houses inside elite public school zones command a 250,000 AUD price premium compared to identical properties situated immediately outside the boundary.
Broad marketing descriptions such as "in the school precinct" or "moments to top-tier education" can often obscure strict statutory cadastral boundaries.
Under state legislation (such as the Victorian Department of Education's Find My School boundaries or the NSW Department of Education catchment polygons), school enrollment entitlements are strictly statutory. They are defined by digital cadastral parcel boundaries, not Euclidean walking distance. If the legislative intake polygon runs down the cadastral centreline of a street:
- House No. 19 (Odd): In-zone. Entitled to state enrolment. Eligible for the $120,000 zone valuation premium.
- House No. 20 (Even): Out-of-zone. Zero entitlement. Subject to out-of-catchment enrollment rejection.
FairBid intersects the property’s verified lot and plan parcel polygon directly against state education department geographic boundaries. If marketing claims school proximity but the cadastral parcel falls outside the statutory polygon:
- The Regulatory Compliance Risk score is adjusted to reflect the boundary reality.
- The Hedonic Model zeroes out the school catchment premium, protecting the buyer from paying in-zone prices for an out-of-zone asset.
Vector 4: Environmental & Climate Risk (Flood Overlay Property Value Impact)
The Real-World Inspection Dilemma
A buyer falls in love with a large, level suburban backyard, planning to install an in-ground swimming pool and a rear studio. After settlement, they lodge a town planning application with the local council, only to have it summarily refused: a designated 1-in-100-year municipal overland flow path bisects the rear lawn, prohibiting any structural construction that impedes stormwater velocity. Simultaneously, their building insurer issues an annual renewal quote jumping from 7,200.
The Algorithmic Architecture Behind the Screen
Climate volatility, extreme weather events, and aging municipal stormwater networks have turned overland drainage into a significant financial hazard.
Many buyers believe that unless a property is next to a river or coastline, they face zero inundation risk. In Australian urban hydrology, however, overland flow paths (flash-flooding corridors) occur far away from natural watercourses. When an extreme storm event dumps 60 millimetres of rain in 45 minutes, low-lying parcels act as natural drainage corridors for surrounding catchment basins.
FairBid overlays cadastral boundaries against:
- Bureau of Meteorology (BOM) historical precipitation models.
- State Emergency Services (SES) designated flood planning levels.
- Local Municipal Planning Overlays (such as Victorian SBO - Special Building Overlays, LSIO - Land Subject to Inundation Overlays, or NSW Flood Planning Areas).
When a parcel intersects an active drainage or inundation overlay:
- Environmental Risk () is elevated (6.0 to 10.0 depending on modeled 1% AEP inundation depth).
- The platform stress-tests Holding Costs: annual building and landlord insurance premiums are modeled to inflate by 250% to 400%, factoring in rising insurer reinsurance costs.
- The model applies a Development Encroachment Discount reflecting the loss of buildable envelope for rear extensions, granny flats, or swimming pools.
Vector 5: Cash Flow & Insolvency Risk (The Holding Cost Bleed)
The Real-World Inspection Dilemma
An investor evaluates a suburban townhouse boasting an advertised 5.2% gross yield. On paper, the $650 weekly rent appears to comfortably cover mortgage repayments. Once settled, however, the owner is hit by the reality of statutory land tax assessments, strata maintenance sinking levies, council rate indexation, and water service charges. With holding costs stripping out $14,000 annually, the property operates in a chronic negative cash flow deficit.
The Algorithmic Architecture Behind the Screen
Headline gross yield is one of the most frequently misunderstood metrics in Australian property advertising. An advertised 5.2% gross yield looks attractive until the owner encounters Australia’s shifting tax and interest rate environment.
Under the Australian Prudential Regulation Authority (APRA) guidelines, financial institutions enforce a 300 basis point (+3.00%) serviceability buffer above the prevailing mortgage interest rate.
At the statutory level, state governments have adjusted general land tax structures. For example, under Victoria’s COVID Debt Repayment Plan, the general land tax threshold was lowered from 50,000. It is crucial to note that this statutory threshold applies specifically to investment properties, holiday homes, and commercial holdings, while Principal Places of Residence (PPR) remain exempt under the Land Tax Act 2005 (Vic). For property investors, however, this change introduced immediate annual cash holding obligations that must be factored into serviceability calculations.
FairBid calculates the Adjusted Net Yield:
Where:
- Capex Reserve: Modeled as of structural dwelling value per annum for modern builds, scaling up to for older, unrenovated dwellings.
- Statutory Taxes: Programmatically calculated based on the asset's Capital Improved Value (CIV) and Site Value under relevant state land tax legislation for secondary/investment assets.
If the calculated Adjusted Net Yield falls below 0.00% under standard APRA stress-testing, the property receives an elevated Insolvency Risk Rating, alerting the buyer that holding the asset will require ongoing monthly cash injections.
3. The Mathematical Heart: The Analytic Hierarchy Process (AHP) Dot-Product Engine
How does FairBid synthesize these vastly different risk vectors—ranging from acoustic decibels and flood inundation depths to strata meeting minutes—into a coherent, actionable risk profile?
We utilize the Analytic Hierarchy Process (AHP), a multi-criteria decision framework that eliminates subjective bias by calculating the mathematical dot-product of calibrated criteria weightings:
[ AHP Multi-Factor Matrix ]
┌──────────────────────────────────────┬────────┬────────────────────────────────────────────────────────┐
│ Dimension                            │ Weight │ Core Focus & Preservation Objective                    │
├──────────────────────────────────────┼────────┼────────────────────────────────────────────────────────┤
│ 1. Environmental Risk (R₁)           │  0.30  │ Physical resilience: overland flood, bushfire (BAL)    │
│ 2. Cash Flow & Insolvency Risk (R₂)  │  0.25  │ Net yield sustainability under APRA +300 bps buffer    │
│ 3. Macro Stability Risk (R₃)         │  0.15  │ Suburb liquidity, interest rate beta, auction clearance│
│ 4. Suburb Level Survey (R₄)          │  0.10  │ LGA development pipeline, 500+ unit supply shocks      │
│ 5. Regulatory Compliance Risk (R₅)   │  0.08  │ Statutory school zones, heritage overlays, setbacks    │
│ 6. Infrastructure Tax Risk (R₆)      │  0.07  │ State land taxes, statutory infrastructure levies      │
│ 7. Volatility Score (R₇)             │  0.05  │ 10-year rolling price standard deviation               │
└──────────────────────────────────────┴────────┴────────────────────────────────────────────────────────┘
The weighting vector is calibrated specifically to prioritize Capital Preservation:
- Physical & Environmental Destruction (): A house subject to severe flooding or bushfire represents an un-hedgeable capital loss threat.
- Operational Cash Flow Survival (): If an owner cannot service holding costs during a cash rate shock, forced liquidation destroys equity before long-term compounding can occur.
- Secondary Market Drivers (): Planning overlays and tax variations impact net returns, but rarely cause total asset impairment.
4. Architectural Divergence: How Our System Calculates Free Tier vs. Paid Tier
A common question from quantitative analysts and property investors is: how does FairBid calculate differently between our Free Tier and our Paid Tier?
In institutional software engineering, a multi-tier platform must solve two conflicting challenges:
- Inspection Velocity (Free Tier): A homebuyer standing on a street curb on Saturday morning inspecting three homes in 45 minutes needs sub-5-second triage: "Does this address have fatal structural defects or flood overlays, and what is its baseline price band?"
- Forensic Due Diligence (Paid Tier): A buyer preparing to register a bidding paddle or sign a legally binding Section 32 contract requires multi-stage, lot-level econometric depth with line-item dollar deductions and actionable legal remediation pathways.
To serve both use cases without compromising analytical integrity, FairBid employs an Architectural Bifurcation Model:
flowchart TD
    Address["Input Property Address"] --> TierCheck{"User Request Tier"}

    subgraph Free["Free Tier (Single-Pass Rapid Triage)"]
        F1["Single-Pass Consolidated Search Grounding"] --> F2["Portal AVM Reconciliation<br/>(Domain & Property.com.au)"]
        F2 --> F3["Baseline 7-Dimension AHP Risk Score"]
        F3 --> F4["Defect Override Filter<br/>(Capex ≥ 8.0 Catchment)"]
        F4 --> F5["2 Free Actionable Care Items<br/>(Locked Forensic Roadmap)"]
    end

    subgraph Paid["Paid Tier (Multi-Phase Forensic Due Diligence)"]
        P1["State Macro Outlook &<br/>APRA +300 bps Serviceability Mesh"] --> P2["Hyper-Local Cadastral & Spatial Valuation<br/>(School Polygons, Rail Transit Distance)"]
        P2 --> P3["Deep Architectural Renovation Analysis<br/>(Aerial Imagery & Permit Historiography)"]
        P3 --> P4["Full Hedonic SHAP Attribution<br/>(Line-Item Dollar Penalties & Premiums)"]
        P4 --> P5["Forensic Strata & Sinking Fund Solvency Audit<br/>(10-Year Capex & Tribunal Litigation)"]
        P5 --> P6["Calibrated Auction Shield<br/>(Risk-Adjusted Walk-Away Ceiling)"]
    end

    TierCheck -- "Free" --> F1
    TierCheck -- "Paid ($4.99)" --> P1
1. Free Tier: Single-Pass Consolidated Diagnostic Architecture
The Free Tier is powered by our single-pass consolidated diagnostic engine. It is engineered strictly for instant triage:
- Unified Search-Grounded Transaction: Rather than triggering multiple asynchronous network hops, the engine executes strictly one consolidated search-grounded LLM transaction. In a single payload, it retrieves ground-truth property specs (bedrooms, bathrooms, car spaces, typology), suburb-level medians, and baseline qualitative risk indicators.
- Portal AVM Reconciliation Model: For valuation, the Free Tier ingests and cross-examines external automated valuation models (from Domain and property.com.au). Our reconciliation algorithm applies a deterministic confidence filter: if one portal returns "High" confidence while the other returns "Medium" or "Low", the engine selects the high-confidence model; if both portals share equal confidence, it computes the calibrated arithmetic midpoint.
- Defect Override Protection: Even in the Free Tier, safety is non-negotiable. If the unified audit detects combustible cladding or severe foundation distress resulting in a Capex Risk score of 8.0 or higher, the Defect Override Rule fires immediately, escalating the overall property rating to Tier 4 (Critical Risk) to warn the buyer before they bid.
- Actionable Insight Capping: The Free Tier synthesizes 2 free actionable care items (e.g. private moisture checks, tenancy lease verification), while locking the deep forensic action roadmap.
2. Paid Tier: Multi-Phase Forensic Due Diligence Engine
The Paid Tier is an exhaustive institutional-grade audit built for buyers ready to execute a transaction:
- Multi-Stage Distributed Pipeline: Instead of a single pass, the Paid Tier executes a sequential multi-model pipeline:
- Macroeconomic & Sovereign Indicator Mesh: Synchronizes live Reserve Bank of Australia cash rate benchmarks, 10-year Commonwealth government bond yields, and APRA +300 bps serviceability stress-testing.
- Hyper-Local Cadastral & Infrastructure Mapping: Evaluates verified lot and plan boundaries, calculates exact pedestrian walking distances to active train stations, and intersects state school zone cadastral polygons.
- Deep Structural Renovation & Extension Analysis: A dedicated model evaluates historical aerial imagery, council alterations summaries, and sales descriptions to distinguish authentic architectural rear extensions from temporary cosmetic staging.
- Econometric Hedonic SHAP Attribution: Unlike the Free Tier's portal reconciliation, the Paid Tier calculates property value from first principles. It synthesizes a 70/30 Econometric Valuation that isolates the exact dollar contribution of every physical and spatial feature (e.g., land size value, age depreciation, acoustic noise decay, vegetation protection overlays [VPO], and solar orientation).
- Forensic Strata & Sinking Fund Solvency: It conducts a 10-year cash flow audit on body corporate records, stress-testing whether current administrative levies and sinking fund reserves can survive anticipated capital replacement schedules without triggering emergency special levies.
- The Fully Calibrated Auction Shield: The Paid Tier unlocks custom user scenario testing. Buyers can adjust holding horizons, expected rental yields, interest rate stress buffers, and maintenance tolerances to calculate their personalized Risk-Adjusted Walk-Away Ceiling.
Direct Comparison: Free vs. Paid System Capabilities
| Analytical Dimension | Free Tier (Rapid Triage) | Paid Tier (Forensic Audit) |
|---|---|---|
| Primary Use Case | Saturday morning open-house triage (sub-5s) | Pre-auction contract exchange due diligence |
| Execution Architecture | Single-pass consolidated search-grounded call | Multi-stage distributed econometric pipeline |
| Valuation Engine | Reconciled Portal AVM (Domain + Property.com.au) | 70/30 Hedonic Econometric SHAP Decomposition |
| Pricing Granularity | High-level estimated valuation range | Line-item dollar contributions (+/-$ impact per feature) |
| Defect Detection | Top-level Defect Override filter (Capex ) | Line-item levy quantification + 10-yr sinking fund solvency |
| Spatial & Planning Depth | Suburb & LGA-level planning overlays | Lot-level cadastral polygon intersection & schedules |
| Acoustic Noise Modeling | Baseline road corridor warning | Exact decibel decay curve () |
| Renovation Historiography | Basic age and renovated flag | Dedicated aerial permit & architectural extension audit |
| The Auction Shield | Standard Risk Tier categorization | Personalized, calibrated Risk-Adjusted Walk-Away Ceiling |
| Actionable Mitigations | 2 Free baseline care items | Fully unlocked forensic action plan with cost estimates |
5. How to Calculate a Walk-Away Auction Price in Australia: The Auction Shield
A risk score is incomplete if it remains purely academic. A homebuyer standing on a crowded suburban front lawn on Saturday morning does not need an abstract score; they need to know their maximum disciplined purchase limit.
In financial markets, a floor represents the minimum liquidation or asset support level. However, for an auction bidder, their walk-away limit is an upper bidding cap / maximum purchase ceiling. Conflating these two concepts creates financial friction.
FairBid resolves this by calculating the Risk-Adjusted Walk-Away Ceiling through the Auction Shield.
flowchart LR
    A["Integrated Risk Score<br/>(1.00 - 10.00)"] --> B["Forecast Standard<br/>Deviation (FSD) Adjustment"]
    B --> C["Downside Stress-Test<br/>Discount Multiplier"]
    C --> D["Risk-Adjusted Walk-Away Ceiling<br/>(Prudent Bidding Cap)"]
    D --> E["The Auction Shield<br/>(Disciplined Walk-Away Rule)"]
The Calculation of the Risk-Adjusted Walk-Away Ceiling
When an asset demonstrates a pristine, low-risk profile (Risk Score 1.0 to 3.0), the model applies a tight Forecast Standard Deviation (FSD) of , indicating high valuation confidence.
However, as qualitative risk factors escalate:
- FSD Expansion: The discovery of unbudgeted capex or environmental overlays widens the valuation uncertainty band to .
- The Stress-Test Downside Buffer: The engine applies a calibrated downside discount multiplier to determine the maximum price a prudent buyer should offer:
For example, consider a suburban home with an estimated unencumbered fair value of $1,400,000 AUD:
- Low Risk Profile (Score 2.2): High valuation confidence; the prudent ceiling sits near fair value at $1,330,000 (-5.0%).
- Elevated Risk Profile (Score 7.8, due to arterial road noise and an overland drainage overlay): The model applies an 18% downside risk buffer, establishing a strict Risk-Adjusted Walk-Away Ceiling of:
Armed with this figure, the buyer steps onto the auction lawn with absolute clarity. While other bidders bid emotionally based on the agent's initial guide, the FairBid user deploys their Auction Shield: they establish an unwavering ceiling at $1,148,000. If bidding exceeds that threshold, they walk away without hesitation, knowing that the successful bidder has paid full price for unquantified tail-risk.
Frequently Asked Questions (FAQ)
What is the calculation difference between FairBid's Free and Paid property audits?
FairBid's Free Tier uses a single-pass consolidated architecture engineered for sub-5-second open-house screening, reconciling portal AVM estimates (Domain and property.com.au) and applying a baseline 7-dimension AHP risk score with defect override protection. The Paid Tier ($4.99 AUD) executes an exhaustive multi-phase econometric pipeline—computing 70/30 Hedonic SHAP attribution with exact dollar-line-item adjustments, lot-level cadastral school polygon mapping, 10-year strata sinking fund solvency modeling, and a fully calibrated Risk-Adjusted Walk-Away Ceiling.
How much does road noise devalue a house in Australia?
Based on hedonic spatial regression modeling across Sydney, Melbourne, and Brisbane, residential properties situated directly on primary arterial transit corridors trade at a persistent discount of 6.0% to 10.0% relative to comparable homes situated 150 metres inside the quiet residential street grid. Acoustic decibel penalties above 55 dB(A) generally result in a 0.8% to 1.2% valuation reduction per decibel.
How does a flood overlay impact property value?
A municipal flood overlay (such as Victoria’s Special Building Overlay [SBO] or Land Subject to Inundation Overlay [LSIO], or NSW Flood Planning Areas) can impact property value in three distinct ways: annual building insurance premiums often inflate by 250% to 400%, rear buildable land envelopes are restricted by council drainage easements, and prospective buyers demand an average 5.0% to 12.0% capital risk discount depending on 1% AEP inundation depth.
What are the most critical strata report red flags in Melbourne and Sydney?
The top three strata red flags to audit before buying an apartment are:
- Combustible Cladding Notices: Any unresolved Project Intervene or Cladding Safety Victoria audit notices requiring special levies.
- Balcony Waterproofing Membrane Failure: Unfunded capex for water ingress repairs, which frequently exceed $50,000 per lot.
- Depleted Sinking / Capital Works Funds: A maintenance reserve holding less than 1.5% of total building replacement value, indicating imminent special levies.
How to calculate a walk-away auction price in Australia?
To calculate a disciplined walk-away auction ceiling:
- Determine the unencumbered baseline fair market value using verified comparable sales.
- Deduct statistically estimated penalties for identified qualitative defects (e.g., road noise, zoning friction, age depreciation).
- Apply a stress-test downside multiplier (typically 5% for low-risk homes up to 15%–20% for homes with severe structural or flood overlays). The resulting figure is your Risk-Adjusted Walk-Away Ceiling—the absolute maximum bid you can submit before the purchase becomes financially imprudent.
Run a Free Address Risk Audit on FairBid
Enter any Sydney, Melbourne, or Brisbane residential property address to uncover unbudgeted strata levies, arterial noise discounts, and statutory school catchments before Saturday morning.
Disclaimer: FairBid provides quantitative data models and general algorithmic estimates only. Outputs do not constitute formal bank valuations under the Australian Property Institute (API) standards, nor do they constitute personal financial, credit, or legal advice. OptiWealth AU provides data-driven algorithms; you should always conduct formal physical building and pest inspections and consult with licensed legal, financial, and credit professionals before making any property acquisition decisions.
JeongSuk Lee
Transparent Data Science & EngineeringData Science, Software Architecture & Mathematical Risk Modeling Group
Authored by OptiWealth’s Quantitative & Data Engineering division. Our team specializes in full-stack software architecture, open-source data science, and spatial econometric property valuation (such as hedonic price regression, environmental zoning overlay synthesis, and cash-flow yield analytics). All underlying algorithms and calculation formulas are fully transparent, open to inspection, and designed purely for financial and property data visualization.
Expose Hidden Property Risks & Liabilities
OptiWealth replaces guessing games with algorithmic diagnostics. Use FairBid to audit council overlays, building defects, and calculate true net property yields.