The Illusion of Diversification: Why Your Pie Chart is Lying to You

Log into almost any retail brokerage app—whether CommSec, Stake, Superhero, or Sharesight—and you will be greeted by a beautifully rendered, multi-coloured pie chart. It visually slices your wealth into tidy sectors: 40% Australian Equities, 30% US Technology, 20% Global Broad Market, and 10% Cash.
Looking at that symmetrical circle, it is easy to feel a sense of financial prudence. You have followed the cardinal rule of investing: don't put all your eggs in one basket.
However, the brokerage industry often keeps retail investors in the dark with what is known in quantitative finance as The Illusion of Diversification.
Standard broker tracking platforms categorize assets using nominal capital allocation and basic asset-class tags. They tell you where your money was spent, but completely fail to explain how your assets co-move under market stress. Think of it like buying three umbrellas: if a hurricane hits, having three umbrellas doesn't offer any more protection than just having one. Beneath that neatly segmented pie chart often lies extreme Nested ETF Concentration risk, hidden asset correlations, and unmeasured tail-risk that can cause multi-asset portfolios to collapse in unison during market turbulence.
At OptiWealth AU, we replace superficial pie charts with Institutional-Grade Tail-Risk analytics. Powered by a native Node.js linear algebra engine, our platform performs real-time covariance matrix decomposition, Black-Litterman optimization, and Hierarchical Risk Parity (HRP) clustering to expose real risk exposure before market drawdowns occur.
The Retail Trap: Standard Broker Tracking vs. Institutional Risk Management
The fundamental flaw of traditional brokerage dashboards stems from modern portfolio presentation. Retail apps treat every ticker symbol as an independent, isolated bucket. If you own five different Exchange-Traded Funds (ETFs) managed by three separate fund providers, your broker interface reports five distinct slices of pie.
Institutional portfolio managers—from global hedge funds to major Australian superannuation funds—approach portfolio construction from an entirely different mathematical paradigm: Risk Contribution.
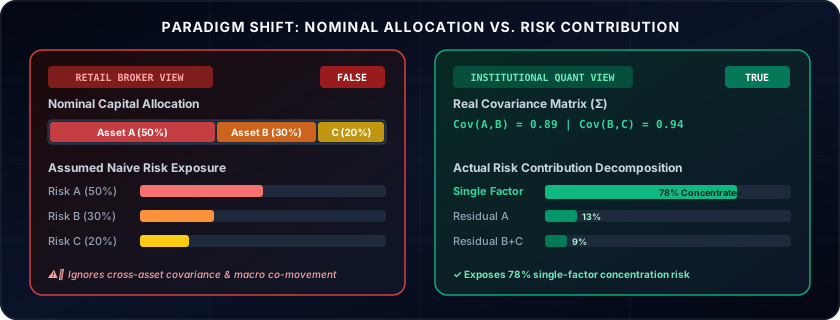
As demonstrated by Nobel Laureate Harry Markowitz in his seminal work on Modern Portfolio Theory (1952), true diversification depends not on the number of assets you hold, but on the pairwise covariance between those assets. When two holdings share identical macro drivers—such as interest rate sensitivity, currency exposure, or overlapping corporate equity holdings—their correlation approaches .
When market panic strikes, nominal diversification evaporates. If your portfolio's underlying holdings share high covariance, your pie chart is simply displaying five different doors to the exact same burning room.
Exposing Nested ETF Concentration Risk
The rise of low-cost passive indexing has made ETF investing immensely popular across Australia. However, it has also given rise to a structural hazard: Nested ETF Concentration.
Many retail investors construct portfolios by combining popular index ETFs, assuming that purchasing multiple tickers across local and global markets guarantees broad asset protection. Let's analyze how this plays out in practice across both domestic and international allocations.
1. The Australian Domestic Overlap (VAS vs. IOZ vs. STW)
Consider an Australian investor holding a mix of Vanguard Australian Shares Index ETF (VAS), iShares Core ASX 200 ETF (IOZ), and an Australian Financials or Resources sector ETF.
On paper, the investor believes they own hundreds of Australian companies. In reality, the ASX 200 index is heavily top-weighted:
- The "Big Four" Banks (Commonwealth Bank of Australia
CBA, National Australia BankNAB, WestpacWBC, and ANZANZ) along with Macquarie Group account for over 25% of the entire index. - Mining & Resources Giants (BHP Group
BHP, Rio TintoRIO, and Fortescue) represent another 15% of index weighting.
By holding multiple broad-market Australian ETFs, you are not diversifying; you are compounding exposure to Australian credit growth, domestic residential mortgage defaults, and Chinese commodity demand. If APRA tightens capital requirements or global iron ore prices drop, all three ETFs drop simultaneously.
2. The Global Tech Trap (IVV vs. VGS vs. NDQ)
An even more extreme example occurs in international equity portfolios. A common Australian retail allocation consists of:
- iShares S&P 500 ETF (
IVV) - Vanguard MSCI Index International Shares ETF (
VGS) - Betashares Nasdaq 100 ETF (
NDQ)
The investor's pie chart displays three distinct international allocations. But a look into the underlying holdings reveals severe overlap:
| Underlying Asset | IVV Weight (%) | VGS Weight (%) | NDQ Weight (%) | Hidden Portfolio Exposure |
|---|---|---|---|---|
| NVIDIA Corp (NVDA) | ~7.8% | ~5.3% | ~8.5% | Critical Overlap |
| Apple Inc (AAPL) | ~7.6% | ~5.2% | ~8.2% | Critical Overlap |
| Microsoft Corp (MSFT) | ~4.4% | ~3.1% | ~4.8% | Critical Overlap |
| Amazon.com Inc (AMZN) | ~3.5% | ~2.4% | ~5.4% | High Overlap |
| Meta Platforms (META) | ~2.0% | ~1.4% | ~4.5% | High Overlap |
(Source: Holdings weighted data synthesized from Vanguard, iShares, and Betashares index disclosures, July 2026)
The "Magnificent Seven" mega-cap technology stocks dominate these markets. When an investor buys IVV, VGS, and NDQ simultaneously, their actual portfolio risk is not spread across global markets. It is hyper-concentrated in a handful of US mega-cap technology firms. During a tech-sector valuation contraction or semiconductor supply chain shock, the pairwise correlation across these three ETFs rises toward unity:
The pie chart promised global safety; mathematical reality delivered unhedged sector concentration.
Measuring Real Covariance: Moving Beyond Historical Averages
To break free from the illusion of diversification, portfolio risk analysis must evaluate Historical Prices, log-returns, and dynamic covariance.
Instead of relying on simple price percentage changes, OptiWealth’s quantitative backend converts historical price series into continuous log-returns:
Using these aligned return vectors, we compute the full sample covariance matrix :
From , we calculate total portfolio variance given asset weights vector :
This matrix equation reveals why pie charts lie. The total risk of your portfolio is not simply the weighted sum of individual asset variances (). It is overwhelmingly dominated by the cross-asset covariance terms ().
If pairwise covariances are positive and large—as is the case with nested ETFs—adding more asset slices actually increases overall portfolio volatility rather than reducing it.
The OptiWealth Engine: Institutional Quantitative Synergy in Action
OptiWealth AU was engineered to bring institutional risk modeling out of locked investment bank trading desks and directly to retail investors. We replace static pie charts with an active, mathematically robust optimization workflow.
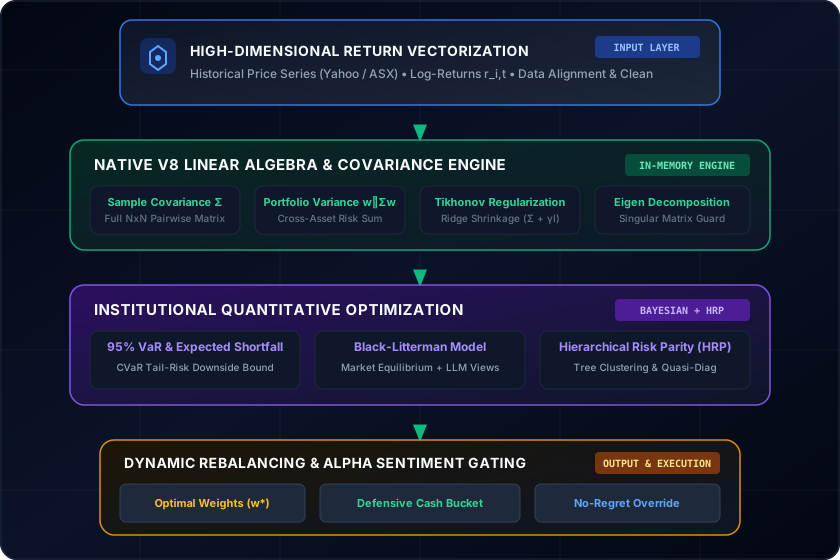
Here is how our underlying engine dismantles false diversification and optimizes your capital:
1. Native V8 Linear Algebra Execution
Many web platforms rely on delayed third-party APIs or heavy external server scripts to process financial calculations. OptiWealth runs a custom, high-performance linear algebra library directly inside the V8 JavaScript backend. This allows instantaneous matrix operations, inverse calculations, and historical backtests across multi-asset portfolios without data latency.
2. Tail-Risk Analytics: 95% VaR & Expected Shortfall (CVaR)
Standard broker tools rely on simple historical standard deviation (volatility), assuming market returns follow a gentle bell-curve (Gaussian distribution). Financial markets, however, exhibit fat tails and extreme downside skewness.
OptiWealth calculates Value at Risk (95% VaR) and Expected Shortfall (95% CVaR):
- 95% Monthly VaR: Represents the threshold loss expecting to be exceeded only 5% of the time over a monthly horizon.
- 95% Expected Shortfall (CVaR): Measures the expected average loss when market drawdowns breach the 95% VaR threshold—capturing severe tail-risk events that standard risk metrics ignore.
To put this into perspective: For a theoretical $100,000 portfolio, if your 95% CVaR is 15%, it means that in the worst 5% of market scenarios, your expected average loss is $15,000—a critical metric that standard volatility completely ignores.
3. Black-Litterman Optimization with Tikhonov (Ridge) Regularization
Classical Markowitz Mean-Variance Optimization suffers from extreme sensitivity: minor changes in expected return inputs often cause the model to output absurdly concentrated portfolio weights (e.g., placing 100% of capital in a single stock).
OptiWealth implements the Black-Litterman Model. We start with global Market Equilibrium Returns derived via reverse optimization from market capitalization weights. We then incorporate subjective forward-looking views, blending them using Bayesian inference.
To prevent matrix singularity when asset returns are highly collinear (as with overlapping ETFs), our engine applies Tikhonov (Ridge) Regularization. By adding a small diagonal shrinkage parameter before matrix inversion:
we promote mathematical stability and target highly precise asset weight outputs.
4. Hierarchical Risk Parity (HRP)
To solve the nested ETF concentration problem once and for all, OptiWealth incorporates Hierarchical Risk Parity (HRP), pioneered by Marcos López de Prado.
Instead of relying on matrix inversion which can fail during correlation breakdown, HRP uses graph theory and machine learning clustering:
- Tree Clustering: Converts the correlation matrix into a distance metric matrix and builds a hierarchical tree (dendrogram) grouping co-dependent assets.
- Quasi-Diagonalization: Re-orders the covariance matrix so that similar assets are grouped together along the diagonal.
- Recursive Bisection: Allocates portfolio weights top-down across clusters based on inverse cluster variance.
If you hold VAS, IOZ, and STW, HRP recognizes their structural equivalence, groups them into a single cluster node, and limits their combined allocation—preventing accidental over-concentration.
5. Alpha-R1 Factor Screening & AI Sentiment Gating
When markets enter extreme panic, correlations across all risky assets spike toward 1.0. During these regime shifts, even optimal equity weightings cannot prevent severe drawdowns.
OptiWealth integrates Alpha-R1 Factor Screening with an AI Sentiment Gating Score (0-100). By monitoring market volatility index indicators, macroeconomic cash rate signals from the Reserve Bank of Australia (RBA), and global risk sentiment, our system applies dynamic penalty multipliers (0.8x - 1.2x) to high-beta assets.
When sentiment drops below safety thresholds, the engine executes a No-Regret Learning Override, automatically rebalancing exposed equity capital into the Defensive Cash bucket until market stability resumes.
Stop Guessing. Measure Your True Portfolio Risk.
A colourful pie chart may look reassuring on a smartphone screen, but it may leave your retirement savings or capital wealth exposed when systemic market shocks hit.
If your portfolio relies on overlapping index ETFs, concentrated financial sector holdings, or unmeasured tech exposure, your pie chart is disguising real concentration risk as diversification.
It is time to elevate your investment strategy from retail guesswork to quantitative precision. With OptiWealth AU, you can run a full Quantitative Portfolio Optimization audit in seconds:
- Expose hidden asset correlations across nested ETFs.
- Calculate your true 95% VaR and Expected Shortfall downside bounds.
- Execute Black-Litterman and HRP rebalancing to maximize your Sharpe Ratio.
Take control of your financial future. Run your portfolio risk analysis on OptiWealth AU today. (By accessing the platform, you acknowledge this is a data-analytics tool and does not constitute automated financial advice.)
Disclaimer: The information provided in this article is for educational and data analytics purposes only. It does not constitute personal financial, investment, or legal advice. OptiWealth AU provides data-driven insights; you should always consult with a licensed financial professional before making any purchasing or investment decisions. Past performance, including historical asset correlations and covariance, is not a reliable indicator of future market behaviour.
Expose Hidden Portfolio & Property Risks
OptiWealth replaces guessing games with algorithmic diagnostics. Create a free account to audit your stock variance or calculate true net property yields.