Would you buy your
biggest asset completely blind?
Your favourite property website gives you a single, unexplained number. We give you the institutional mathematical truth. Uncover hyper-local premiums, structural holding costs, and hidden risks before you bid.
The Reality Check
We don't care what platform you use.
Almost every financial portal and real estate site is obsessed with selling a dream: charts going up and to the right, or pictures of perfect house renovations. They want transactions.
We focus on the reality: What happens when the market turns or you inherit a hidden structural defect?
For Stocks & ETFs
We don't care what broker you execute on (e.g., CommSec, Stake, SelfWealth). You execute the trades. We scan the ETF stock overlaps and Value at Risk.
For Real Estate
We don't care what portal you search on (e.g., realestate.com.au, Domain) or what buyer agent you hire. You make the purchase. We audit the CapEx, overlays, and net yield.
You build your wealth. We manage the risk.
The Companion Model
Your Assets. Our Armour.
OptiWealth integrates alongside your stock broker and buyer agents to manage risk.
Map Your Holdings
Securely enter your shares, investment ETFs, or target property addresses. Because we do not request direct broker linkages, your financial credentials remain completely sovereign.
Run the Risk X-Ray
Our quantitative engines scan stock fund holdings (breaking down underlying index fund constituent weights) to find overlaps, and scan property lists to expose statutory taxes and maintenance reserve friction.
Optimize allocations
Receive cash inflow rebalancing commands using Mixed-Integer Linear Programming, optimizing allocations tax-efficiently without triggering Capital Gains Tax.
The Valuation Gap
Standard valuations are hiding the truth.
Do you buy just by checking listed numbers and generic estimates without any explanations? Standard algorithms ignore the physical and financial reality of the asset.
Generic Property Portals
Standard Estimates
- •Suburb Averages: Values properties purely on broad postcode statistical averages, completely ignoring layout defects and high-risk planning overlays.
- •Black-Box Estimates: Generates generic valuation figures without detailing what physical or geographic drivers actually determine the price.
- •Hidden Outgoings: Shows superficial gross value estimates, hiding strata levies, land tax, maintenance allowances, and actual net cash flow.
- •Agent Conflicts: Sponsored by listing agents and brokers whose primary incentive is to close transaction volume, not protect your capital.
The OptiWealth Advantage
Institutional Risk Modelling
- Hedonic Pricing Model: Calculates the exact dollar value contribution of school zones, transport links, and micro-location factors.
- Environmental & Zoning Audits: Cross-references zoning schemes, heritage listings, land slips, and environmental hazard overlays.
- Granular Outgoings Ledger: Forecasts actual holding outgoings including land tax, insurance, strata levies, maintenance, and vacancy rates.
- AHP Synthesis: Renders a structured multi-criteria decision audit to isolate age-depreciation penalties and layout issues.
Under the Hood
The Real Estate Risk Model
Standard pricing portals guess values based on municipal averages. OptiWealth runs a localized, multi-vector risk audit to ensure you don't buy a toxic asset.
Spatial Hedonic Deconstruction
We use additive SHAP coefficient algorithms to mathematically dissect the value contribution of layout configurations, street types (corner allotments vs main roads), school zone ranks, and transport proximity.
Mathematical Net Yield Ledger
Exposes true out-of-pocket holding costs. The engine calculates statutory land taxes, municipal rates, building insurance, and vacancy defaults, subtracting a pre-1996 era maintenance reserve (up to 3% of value).
Structural Defect Crawler
Scans online real estate archives, news directories, and registry documents to identify previous listing history, structural defect notices, underpinning repairs, or ongoing body corporate litigation.
Environmental Planning Survey
Cross-references municipal GIS planning databases to detect direct overlays: heritage listings (HO21), Special Building Overlays (SBO stormwater flash flood), and Land Subject to Inundation (LSIO).
AHP Synthesis Engine
Resolves conflicting metrics (e.g. good schools vs severe land taxes) by executing an Analytic Hierarchy Process weighting (30% environment, 25% yield, 20% capex) to output a unified Risk Score.
Printable 4-Section Dossiers
Generate print-optimized dossiers directly from the dashboard containing four detailed sections (Specs, Outgoings Ledger, Qualitative Risk Matrix, and AHP Synthesis) to share with mortgage brokers or financial advisors.
Liquid Assets
ETF & Share Portfolio Analytics
Advanced Quantitative Optimisation (Zero CGT Impact)
We use advanced quantitative models (including Black-Litterman and Mixed-Integer Linear Programming) to calculate exactly how to allocate cash. Our "Smart Inflow" logic tells you exactly what whole shares to buy with new cash to reach your target risk profile—without selling existing positions or triggering a Capital Gains Tax (CGT) event.
Deep-Scan "X-Ray" Portfolio Analysis
Think you’re diversified because you own multiple different index ETFs? Our X-Ray engine breaks down funds into their underlying company holdings to reveal hidden concentration risks. We also calculate your True Value at Risk (VaR) and Conditional VaR (CVaR)—showing your exact expected dollar loss in an extreme market crash.
Liquid Portfolio Showcase
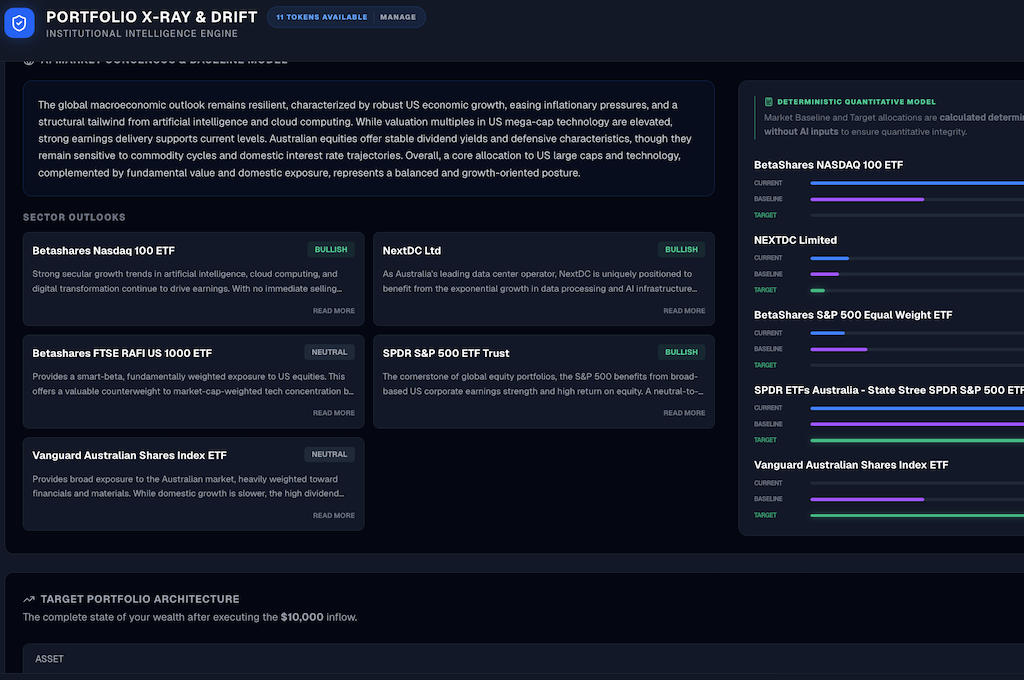
Expose ETF concentration and True Value at Risk.
Our mathematical companion engine scans your entire stock and ETF holdings to reveal the underlying company weights behind your index funds. Visualize your portfolio Value at Risk (VaR) and Conditional VaR (CVaR) before a correction occurs.
ETF X-Ray scans
Deconstruct index funds to find company-level concentrations across different managers.
Expected Loss Metrics
Track your portfolio's expected dollar loss under historical crash models.
Smart Inflow Rebalancing
Optimize allocations with new cash using tax-aware Linear Programming.
Real Estate Showcase
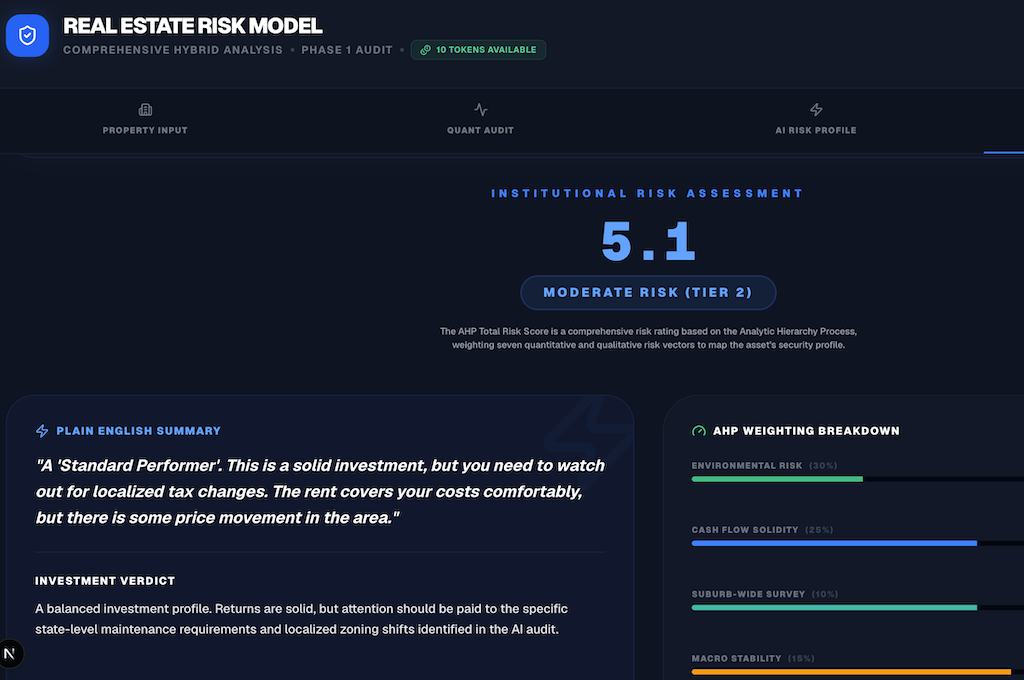
Did you check the potential risks that will degrade your portfolio?
Our proprietary AI synthesis doesn't just read zoning documents; it acts as a holistic risk evaluator. It cross-references heritage overlays with age-based maintenance algorithms to expose negative cash flow before you inherit someone else's money pit—specifically catching the -$35,000 structural degradation penalty and negative cash flow on the 1940s build.
Specifications Audit
View era-based age penalties and additive coefficients for location premium assets.
Yield Recalibration
Calculate true out-of-pocket costs after subtracting land tax and maintenance.
AI Risk Synthesis
Synthesize structural defects, flooding alerts, and council guidelines into AHP ratings.
Pricing
Transparent, usage-based intelligence.
Priced to give you an unfair advantage. Pay only for the computational power you need.
Free Trial
Experience the power of algorithmic risk management.
- 1 Free AI Audit Token (valid for 6 months)
- Unlimited Stocks & ETF VaR tracking
10 Token Pack
Perfect for active wealth monitoring.
- 10 Deep Property AI Audits (valid for 6 months)
- Full stock portfolio drift & sector concentration scans
- Advanced Black-Litterman cash inflow optimisation
30 Token Pack
Full-spectrum power for active global investors.
- 30 Deep Property AI Audits (valid for 6 months)
- Full stock portfolio drift & sector concentration scans
- Advanced Black-Litterman cash inflow optimisation
FAQ
Frequently Asked Questions
Everything you need to know about our institutional-grade risk platform.
How is OptiWealth different from standard wealth trackers?
Standard websites track past performance and show simple line charts going up. OptiWealth acts as your personal Quantitative Portfolio Risk Manager and Real Estate Risk Model. We decompose stock holdings (e.g. underlying ETF stock weights) to find real concentrations, while search-grounding property listings to run net yield holding-costs and CapEx stress simulations.
Why don't you connect to my broker or bank account?
Zero-Trust security. By avoiding bank logins, we eliminate the primary vector for financial account breaches. You maintain total data sovereignty. Our "Shadow Portfolio" model allows you to run stress tests and math-driven rebalancing without exposing your actual trading accounts to the web.
How does the Real Estate Risk Model work?
Our model executes Google Search grounded prompts targeting real estate portals, local council databases, and planning schemes. It extracts exact hedonic features (zoning codes, era built, bathroom counts, heritage codes) and applies them to an additive SHAP coefficient model, cross-referenced with a mathematical outgoings reserve ledger.
Ready to see the math behind your next investment?
Join professional investors who rely on OptiWealth's quantitative audits to protect their portfolios, manage holding costs, and maximize true net yield.
Create Your Account TodayIncludes 1 free token on sign-up • No credit card required