Vacancy Rate Analysis: How Australian Buyers Should Read It
This tool is a generic calculator and does not advertise or promote a specific financial product. It is not intended to be relied on for the purposes of making a decision in relation to a financial product. You should consider obtaining advice from a financial services licensee before making any financial decisions.
Vacancy Rate Analysis: How Australian Buyers Should Read It
The rental vacancy rate is the proportion of rental dwellings in a defined market that are vacant and available for lease at a point in time. For a buyer or investor, vacancy rate analysis converts that single percentage into a judgement about rental demand, income reliability and downside risk in a specific suburb. The figure is useful, but it is also less standardised than most commentary implies, and it must be read alongside yield, holding costs and property-level risks before it informs a bid.
TL;DR
- The vacancy rate equals vacant rental dwellings divided by total rental dwellings in the same area, expressed as a percentage.
- The commonly cited 3 per cent threshold is a convention, not a law. Australian housing research describes it as borrowed from commercial property and of uncertain fit for residential housing.
- Vacancy rates in Australia are produced by private data firms with differing methodologies, so two sources can report different figures for the same suburb and month.
- A suburb figure is most reliable when tracked as a trend across several periods and compared with dwelling type, supply pipeline and net rental yield.
- Vacancy is one input. Strata levies, council overlays and structural defects can erode returns even where vacancy is low.
Table of Contents
- What the vacancy rate measures
- Why the 3 per cent benchmark needs qualification
- A structured approach to suburb vacancy analysis
- Worked example: two suburbs, one decision
- What vacancy rate cannot tell you
- Our perspective
- Applying vacancy analysis before an auction
- Independent audits with OptiWealth FairBid
- Frequently asked questions
- Sources
What the vacancy rate measures
The definition is arithmetic:
$$\text{Vacancy rate} = \frac{V}{R} \times 100$$
where $V$ is the number of rental dwellings vacant and available for rent, and $R$ is the total number of rental dwellings in the same market. A suburb with 2,000 rental dwellings and 50 vacant has a vacancy rate of 2.5 per cent.
Three features of that definition determine how the figure should be interpreted.
- The denominator is rental stock, not all dwellings. A suburb dominated by owner-occupiers can show a volatile rate because a small absolute change in vacancies moves a small denominator.
- The numerator is a snapshot. A dwelling counts as vacant only while it is advertised or otherwise available. Properties between tenants for a few days appear and disappear in the count.
- Geography is a choice. The same property can be reported inside a postcode, a suburb, a statistical area or a capital-city aggregate, and each aggregation produces a different number.
A low rate signals that tenants have limited choice and landlords can usually re-let quickly. A high rate signals that tenants have alternatives, which tends to restrain rent growth and lengthen the time a property sits empty. The direction of that relationship is dependable. The precise threshold at which one regime becomes the other is not.
Why the 3 per cent benchmark needs qualification
Media commentary frequently describes a vacancy rate below 3 per cent as a tight market and above 3 per cent as oversupplied. The Australian Housing and Urban Research Institute (AHURI) addressed this directly in a critical review of the rental vacancy rate measure. Its findings are relevant to any buyer relying on a single published figure:
- The producers of the rate in Australia are private, commercial organisations specialising in housing and property data.
- There is no consistent methodology or single data source, and the varied approaches result in different figures.
- The 3 per cent benchmark is a conceptual threshold adapted from commercial property markets, and residential vacancy is shaped by household choices, savings behaviour and ownership shifts, not only by supply and demand gaps.
The practical consequence is that a buyer should record which publisher a figure came from, which geography it covers and which month it describes. Comparing a figure from one provider for suburb A with a figure from another provider for suburb B is a methodological error, even when both are labelled “vacancy rate”.
A structured approach to suburb vacancy analysis
The following sequence applies to a residential purchase, whether the buyer intends to live in the property or let it.
Step 1: Fix the source and the geography
Select one published series and use it for every suburb under comparison. Note the geography (suburb, postcode or wider region) and the reporting date. Where a suburb is small, prefer the postcode or a broader region, because a thin rental market produces noisy readings.
Step 2: Read the trend, not the point value
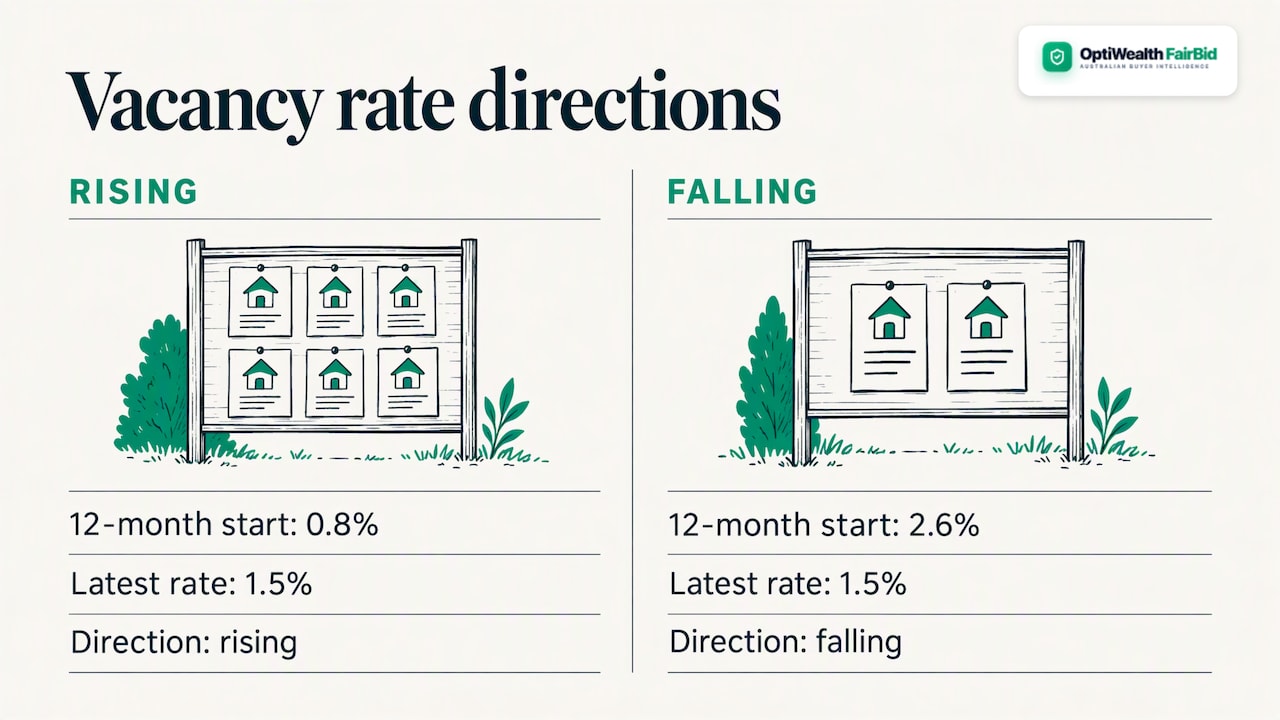
A reading of 1.5 per cent that has risen from 0.8 per cent over twelve months describes a different market from a reading of 1.5 per cent that has fallen from 2.6 per cent. Collect at least four to six periods and classify the direction. As a working rule, treat a single-month movement as noise unless it is confirmed by the following period.
Step 3: Segment by dwelling type
AHURI’s research on changed patterns of dwelling demand and supply notes that Australian owner-occupied and rental stock are highly substitutable, so investors and first-home buyers often compete for the same properties. In practice a suburb aggregate blends detached houses and apartments, which behave differently. A suburb with a tight house market can still carry a heavy apartment pipeline. Where the published data allows, compare units and houses separately.
Step 4: Examine the supply pipeline
Vacancy is a function of future as well as current supply. Government analysis indicates that rental pressures are expected to moderate only gradually as new supply is delivered under the National Housing Accord, with building approvals and construction times central to that outcome. For a specific suburb, check local development approvals and the number of apartments under construction, because a concentrated completion of new apartments can lift vacancy within a single leasing season.
Step 5: Convert vacancy into income risk
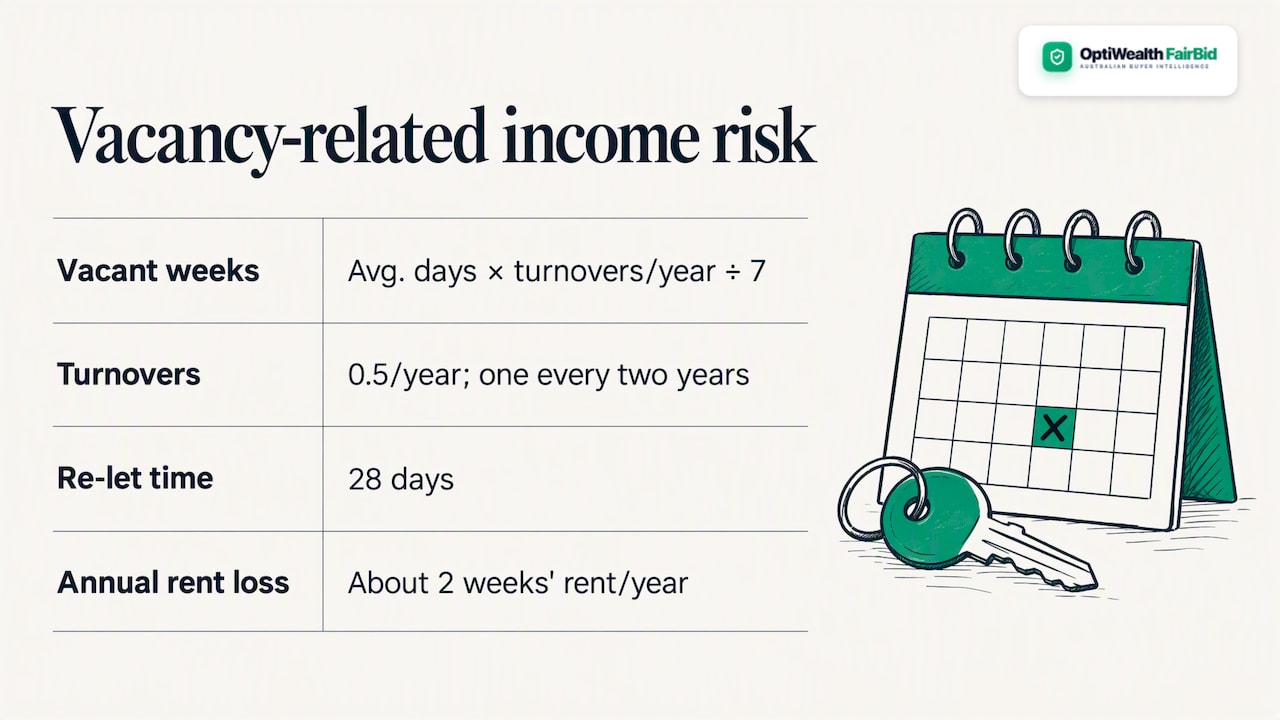
Vacancy rate describes the market, but a landlord’s exposure is the expected vacant weeks per year on one dwelling. As an approximation:
$$\text{Expected vacant weeks} \approx \text{average days to re-let} \times \frac{\text{turnovers per year}}{7}$$
A property that turns over every two years (0.5 turnovers per year) and takes 28 days to re-let loses about two weeks of rent per year on average. Stress-testing that assumption at, for example, double the re-let time shows how sensitive net income is to vacancy. This is the same discipline applied in our guidance on stress testing rental yield.
Step 6: Combine vacancy with net yield
A low vacancy rate attached to a thin yield can be a poorer outcome than a moderate vacancy rate attached to a strong net yield. The reconciliation of gross rent, vacancy allowance, management fees, council rates, insurance and strata levies is covered in our analysis of what constitutes a reliable rental yield and in the comparison of capitalisation rate and yield.
Worked example: two suburbs, one decision
The following illustration uses hypothetical figures to show the method. It does not describe any actual suburb.
| Metric | Suburb A (houses) | Suburb B (apartments) |
|---|---|---|
| Vacancy rate, current | 1.1% | 1.4% |
| Vacancy rate, 12 months earlier | 1.0% | 0.7% |
| Direction | Stable | Rising |
| Apartments under construction | Minimal | Substantial |
| Gross rental yield | 3.6% | 4.8% |
| Annual strata levies | Nil | $4,200 |
| Special levy notified in vendor documents | Not applicable | Yes |
Suburb B appears superior on gross yield and is only marginally higher on vacancy. However, the vacancy trend is rising, the pipeline is heavy, and strata levies and a notified special levy reduce net income. Once a vacancy allowance is raised and levies are deducted, the net yield gap narrows and may reverse. Suburb A offers a lower headline yield but a more predictable income stream. The point is not that one is correct; it is that the vacancy figure only becomes decision-grade when it is combined with the other variables.
What vacancy rate cannot tell you
Vacancy rate is a demand and supply indicator. It does not reveal the condition of an individual dwelling or the liabilities attached to its title. Four categories of risk sit outside the statistic:
- Underquoting. A tight rental market can coincide with competitive auctions in which the advertised price guide understates the likely sale price. A strong vacancy reading does not justify bidding above the independently estimated value. Our note on price negotiation and underquoting sets out the mechanics.
- Strata liabilities. Apartment buyers should review the strata report, including the sinking fund balance, scheduled capital works and any special levy, in conjunction with the Section 32 / vendor statement where applicable to the state.
- Council overlays. Flood, bushfire and heritage overlays can affect insurance premiums, building approvals and the pool of future tenants and buyers.
- Structural defects. A dwelling with latent defects can sit vacant during repairs regardless of market conditions. A building inspection checklist is the appropriate control.
A broader treatment of these exposures appears in our overview of property risk assessment.
Our perspective
We regard the vacancy rate as a necessary but insufficient input. Its principal weakness is not that it is inaccurate, but that it is frequently presented without its provenance. Since publishers calculate it differently, a buyer who quotes “the” vacancy rate for a suburb is usually quoting one firm’s estimate for one geography on one date.
Our approach to property due diligence treats a dwelling as a bundle of separable attributes, not an indivisible monolith. Location, dwelling type, strata position, planning constraints and condition each contribute to value and to risk, and each should be assessed on its own evidence. Vacancy belongs to the location component. It should therefore be weighted with, and never substituted for, the property-specific components.
We also hold that analysis intended for buyers must be structurally independent of the selling process. FairBid operates with no agent commissions and no advertising kickbacks, so the output is not shaped by an interest in a transaction closing. For an investor, that independence is most valuable where vacancy data appears favourable, because favourable market statistics are precisely the context in which a guide price is most likely to be optimistic.
— JeongSuk Lee
Applying vacancy analysis before an auction
A disciplined sequence reduces the chance that a favourable market statistic overrides property-level evidence.
- Establish an independent estimate of market value before reading the agent’s price guide.
- Record the suburb vacancy rate, its source, its geography and its twelve-month trend.
- Model net yield with a vacancy allowance at least as conservative as the observed local conditions justify, and run a downside case.
- Review the Section 32 / vendor statement, strata report and planning overlays for liabilities that vacancy does not capture.
- Set a walk-away price from these inputs and treat it as binding on the day.
The interaction between value, loan and security is also relevant for investors, since an independent valuation can influence borrowing outcomes, as discussed in our note on loan to value ratio. Investors holding property in a self-managed super fund should confirm structure and borrowing rules with a licensed financial adviser or accountant before proceeding, because the vacancy assumptions feed directly into serviceability and liquidity planning.
Research on the housing system supports treating these variables jointly. The Reserve Bank of Australia’s empirical model of the housing market quantifies the interrelationships between construction, vacancies, rents and prices, which indicates that vacancy is one node in a connected system and not an isolated predictor.
Independent audits with OptiWealth FairBid
OptiWealth FairBid, available on iOS and Android, applies spatial AI and hedonic pricing to a specific Australian residential address. The output includes an independent fair market valuation, planning and strata checks, rental yield estimates, a bear case downside threshold and school and catchment diagnostics. The Free Tier costs $0 (AUD, one-off), and the Paid Advocate Tier, which provides the detailed buyer advocate audit report, costs $4.99 (AUD, one-off). Buyers can review the format in the sample property report or start from the OptiWealth home page.
Frequently asked questions
What is a good vacancy rate?
There is no single good rate, because the answer depends on whether you are a landlord or a tenant. Many commentators treat rates below 3 per cent as indicating strong rental demand, but AHURI cautions that this benchmark was adapted from commercial property and is not a universal threshold. For an investor, the trend and the net yield matter more than any fixed cut-off.
Why do different websites show different vacancy rates for the same suburb?
Because the rate is produced by private organisations that use different data sources and methods, and AHURI notes there is no consistent methodology or single data source. Differences in geography, dating and the treatment of advertised listings all change the result. Use one source consistently when comparing suburbs.
Does a low vacancy rate mean a property is a safe investment?
No. A low rate indicates favourable rental demand in the area, but it says nothing about the purchase price, strata levies, special levies, flood or bushfire overlays or structural condition of a particular dwelling. These factors can reduce net returns even where tenants are plentiful.
How often should I check the vacancy rate before buying?
Check it when you shortlist a suburb and again in the week before the auction or contract exchange. Compare at least several consecutive periods so that you can distinguish a trend from a one-month fluctuation.
Sources
- Demystifying the rental vacancy rate measure: a critical review and policy implications (AHURI)
- The new normal: changed patterns of dwelling demand and supply (AHURI)
- Good progress on the way to 1.2 million homes as supply accelerates (Treasury Ministers)
- A Model of the Australian Housing Market (Reserve Bank of Australia)
The information provided in this publication is for educational and general information purposes only and does not constitute financial, investment, taxation, or legal advice under the Corporations Act 2001 (Cth). Property buyers and investors should conduct independent physical, legal, and strata due diligence and seek advice from a licensed financial advisor, solicitor, or conveyancer tailored to their personal objectives before entering into any legally binding contract of sale.
OptiWealth Research
Transparent Data Science & EngineeringData Science, Software Architecture & Mathematical Risk Modeling Group
Authored by OptiWealth’s Quantitative & Data Engineering division. Our team specializes in full-stack software architecture, open-source data science, and spatial econometric property valuation (such as hedonic price regression, environmental zoning overlay synthesis, and cash-flow yield analytics). All underlying algorithms and calculation formulas are fully transparent, open to inspection, and designed purely for financial and property data visualization.
Expose Hidden Property Risks & Liabilities
OptiWealth replaces guessing games with algorithmic diagnostics. Use FairBid to audit council overlays, building defects, and calculate true net property yields.